This strategy is said to be very reliable, specially on higher timesframes (D1 and more).
Weekly chart analisis:

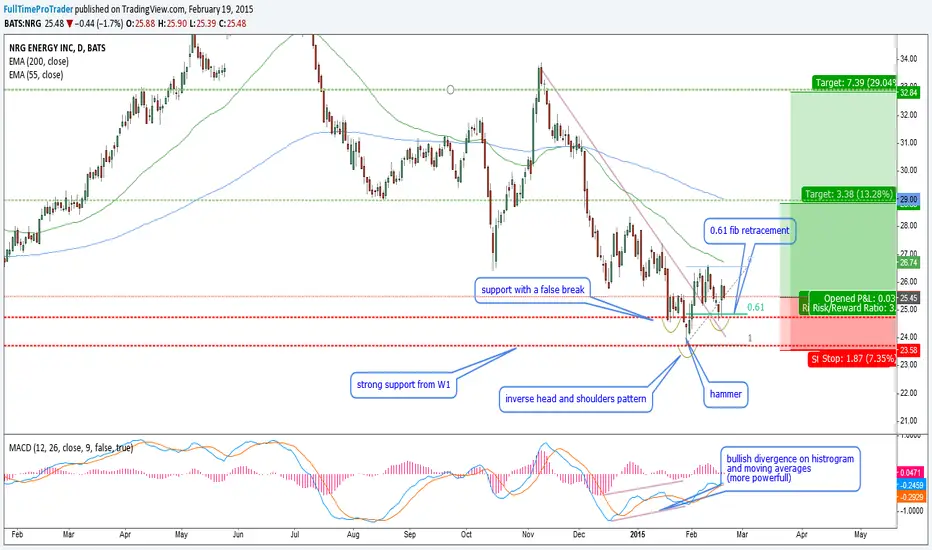
Here is the textbook theory:
1) Prices is on clear downtrend
2) Prices breaks an important area of S/R and retraces inmediately (within 3 candles)
3) There is divergence on histogram and moving averages on MACD
4) Risk/Reward ratio: at least 1 to 2
Here we have also an inverse head and shoulders pattern
Lets see what happens
Best Regards
Weekly chart analisis:
Here is the textbook theory:
1) Prices is on clear downtrend
2) Prices breaks an important area of S/R and retraces inmediately (within 3 candles)
3) There is divergence on histogram and moving averages on MACD
4) Risk/Reward ratio: at least 1 to 2
Here we have also an inverse head and shoulders pattern
Lets see what happens
Best Regards
Disclaimer
The information and publications are not meant to be, and do not constitute, financial, investment, trading, or other types of advice or recommendations supplied or endorsed by TradingView. Read more in the Terms of Use.
Disclaimer
The information and publications are not meant to be, and do not constitute, financial, investment, trading, or other types of advice or recommendations supplied or endorsed by TradingView. Read more in the Terms of Use.