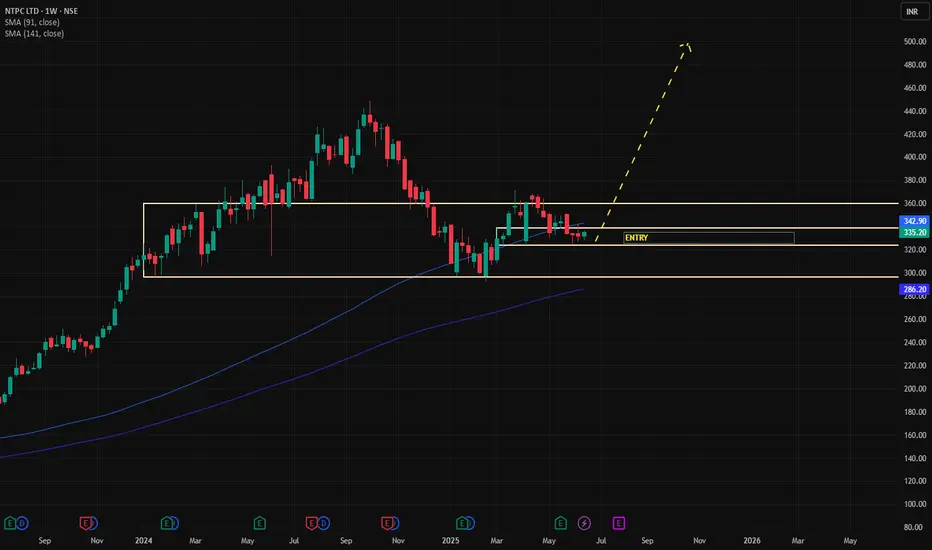
📈 Trade Setup: BUY at 338
Parameter Value
Entry Price 338
Stop Loss (SL) 323
Risk 15
Target 494
Reward 156
Risk:Reward (RR) 10.4
Last High 448
Last Low 292
✅ Trade Interpretation
Entry Zone (338) is exactly at Weekly & Daily Demand.
SL (323) is just below this demand zone – protects from fake breakdowns.
Target (494) is ambitious, well above the previous high of 448, suggesting a potential breakout trade.
Risk-Reward Ratio (10.4) is exceptional – highly favorable trade.
📌 Key Observations
Stacked Demand Zones across all timeframes (from 323 to 338) give confidence in entry.
Momentum alignment across all timeframes (HTF, MTF, ITF) → indicates trend continuation.
Target (494) is logical if price breaks above last high (448) – breakout + momentum.
🔔 Suggested Strategy:
Entry near 334–338 zone, preferably on a bullish confirmation candle.
Trail SL once price crosses 360–380 range (monthly midpoint).
Partial booking near 448, and hold for extended target 494 if strength continues.
🔍 Multi-Timeframe (MTF) Analysis – NTPC
🔸 Higher Time Frame (HTF)
Trend: Strong UP across all (Yearly, Half-Yearly, Quarterly)
Key Demand Zones:
Yearly & Half-Yearly: 315–292 (Avg ~305)
Quarterly: 393–296 (Avg: 345)
HTF Average Demand Zone: 341–295, Avg 318
Interpretation: Robust long-term support zones, especially with demand logic and breakout structures forming.
🔸 Medium Time Frame (MTF)
Trend: All UP (Monthly, Weekly, Daily)
Zones:
Monthly: 360–296 (Avg: 328)
Weekly: 338–323 (Avg: 331)
Daily: 338–323 (Avg: 329)
These are all tightly stacked → indicates strong short- to mid-term support at 323–338.
🔸 Intraday Time Frame (ITF)
Trend: All UP (240M, 180M, 60M)
All have the same zone: 334–323 (Avg: 329)
Supports the entry zone very well — short-term traders are aligned with higher timeframe momentum.
Disclaimer
The information and publications are not meant to be, and do not constitute, financial, investment, trading, or other types of advice or recommendations supplied or endorsed by TradingView. Read more in the Terms of Use.
Disclaimer
The information and publications are not meant to be, and do not constitute, financial, investment, trading, or other types of advice or recommendations supplied or endorsed by TradingView. Read more in the Terms of Use.