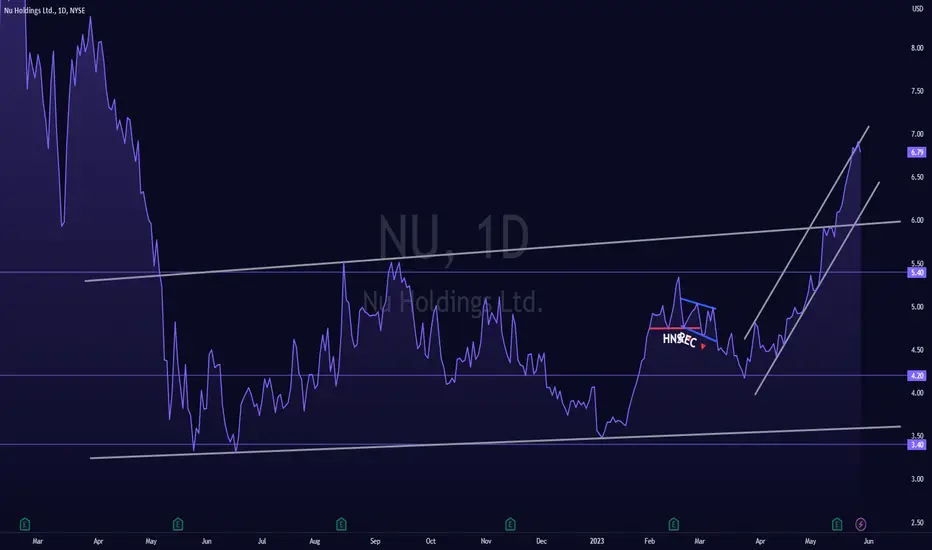
🔹Horizontal trend channel in the medium long term is broken up.
🔹RSI is above 70 after a good price increase the past weeks..
🔹The RSI curve shows a rising trend, which could be an early signal of the start of a rising trend for the price as well.
🔹Overall assessed as technically positive for the medium long term.
Chart Pattern;
🔹DT - Double Top | BEARISH | 🔴
🔹DB - Double Bottom | BULLISH | 🟢
🔹HNS - Head & Shoulder | BEARISH | 🔴
🔹REC - Rectangle | 🔵
🔹iHNS - inverse head & Shoulder | BULLISH | 🟢
Verify it first and believe later.
WavePoint ❤️
The most profitable U.S. Stock VIP Signals Provider in Telegram Channel | Check our latest product updates: bit.ly/wavepoint-vip |
For more info:
Telegram: t.me/Wel_99
X: x.com/wavepoint99
For more info:
Telegram: t.me/Wel_99
X: x.com/wavepoint99
Disclaimer
The information and publications are not meant to be, and do not constitute, financial, investment, trading, or other types of advice or recommendations supplied or endorsed by TradingView. Read more in the Terms of Use.