Long
Nuls vs USD
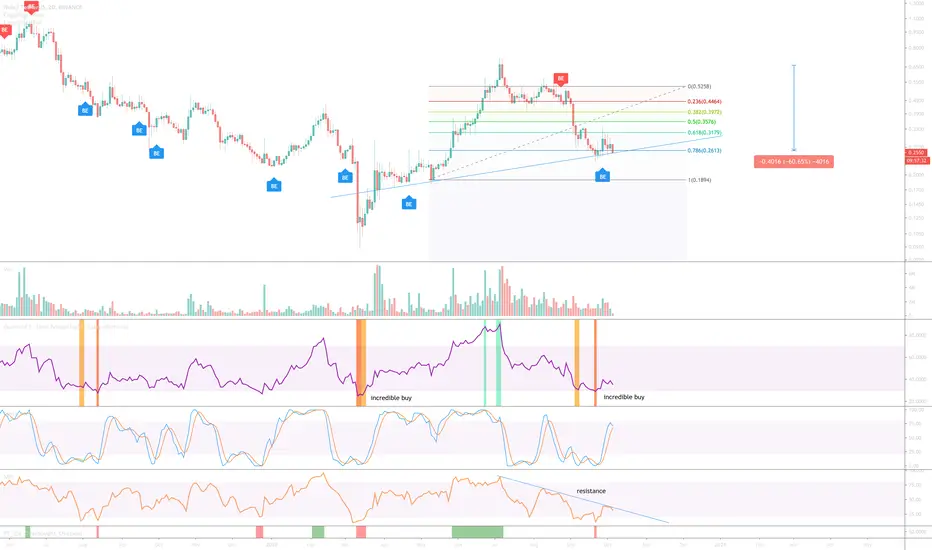
The 2-day chart for nuls has a number of bullish signals difficult to ignore. They include:
1) 60% collapse in price action from early July to the golden ratio (swing high to swing low).
2) Oversold indicator (orange and dark orange) on RSI.
3) The Bitcoin chart is also oversold with support on the 21-day (for now!)
On the bearish side:
1) MFI resistance continues. However this is now the 3rd month in a downtrend, the end of this resistance is likely near - so keep a watchful eye.
Is it possible price collapse further?
Absolutely, whatever Bitcoin does in the days / weeks ahead will have an impact here. This is also why I look at the Bitcoin chart.
Is it probable price action increases from here?
Yes. We’ve reached and exited an oversold condition. Look left.
Is it the bottom? Who knows, a bitcoin collapse could pull back price action much further down. Fearful? Good, that's where the best opportunities lie.
1-day Bitcoin chart
Note
Higher low printed a few days ago. First target around 38 cents or 35% from current price action.Note
The most recent weekly candle printed a long wick indicating momentum to the upside, almost a Dragonfly DOJI. In combination with this momentum we have oversold Stochastic RSI crossing upward - fantastic moment to add to any long positions.Trade active
Bullish divergence + rising Stochastic RSI past 20.Trade active
RSI resistance breaks out. Has been acting as resistance since July 2nd.Note
Kaboom! And we're off - sit back relax until reversal.Leave a comment below if you wish me to update, I don't actually hold.
Trade active
Note
Looking good - Ascending triangle + volumeWait until price breaks to the upside, wait for confirmation of support on previous resistance before taking a long position.
Trade active
Price action again confirms support with a breakout of MFI resistance. Trade active
Trade active
Note
9 oscillators showing positive / bullish divergence with price action - crazy 😜 lower lows continue to be printed. Trade active
For anyone still interested in this token a move to $1.50 in the near future seems highly probable according to the 10-day chart below.Trade active
Near future arrives 24 days later.Trade active
For the life of me I cannot be bothered publishing a new idea on this one. The current chart below might be of interest to someone as price action returns to the same level from 2 years ago.Price action on the daily is quite bullish following a recently higher high print. Now price action is on the 0.236 Fib level
6hr
BTC
bc1q2eckdzh0q8vsd7swcc8et6ze7s99khhxyl7zwy
Weblink: patreon.com/withoutworries
Allow 3-6 months on ideas. Not investment advice. DYOR
bc1q2eckdzh0q8vsd7swcc8et6ze7s99khhxyl7zwy
Weblink: patreon.com/withoutworries
Allow 3-6 months on ideas. Not investment advice. DYOR
Disclaimer
The information and publications are not meant to be, and do not constitute, financial, investment, trading, or other types of advice or recommendations supplied or endorsed by TradingView. Read more in the Terms of Use.