My take on NVDA from an Elliott Wave perspective. Maybe it will help someone.
After clearly an impulse wave down who finished on 13th October 2022 that's intermediate wave (A)
we have 2 scenarios:
Scenario nr 1: Bearish

We have an ABC zigzag pattern finished.Why?
We have multiple Fibonacci ratios pointing for a top in NVDA.one of them 1.618multiple for minor wave C.
If this is the right count what we need to see further is an impulsive wave down for intermediate wave (C)
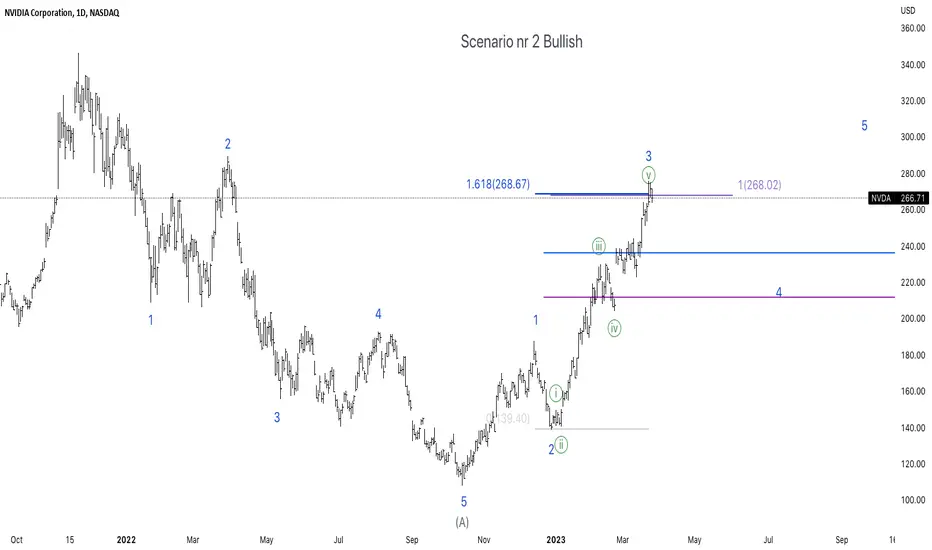
Scenario nr 2 Bullish

This Fibonacci ratio of 1.618 is almost a trademark for wave 3 in an impulse wave.
So key levels here to watch are 0.236 and 0.382 retracements. If this is a shallow time consuming retracement with all the signs of a wave 4 we will still have wave 5 to go.
What do you think?
Legal Disclaimer: The information presented in this analysis is solely for informational purposes and does not serve as financial advice.
After clearly an impulse wave down who finished on 13th October 2022 that's intermediate wave (A)
we have 2 scenarios:
Scenario nr 1: Bearish
We have an ABC zigzag pattern finished.Why?
We have multiple Fibonacci ratios pointing for a top in NVDA.one of them 1.618multiple for minor wave C.
If this is the right count what we need to see further is an impulsive wave down for intermediate wave (C)
Scenario nr 2 Bullish
This Fibonacci ratio of 1.618 is almost a trademark for wave 3 in an impulse wave.
So key levels here to watch are 0.236 and 0.382 retracements. If this is a shallow time consuming retracement with all the signs of a wave 4 we will still have wave 5 to go.
What do you think?
Legal Disclaimer: The information presented in this analysis is solely for informational purposes and does not serve as financial advice.
Disclaimer
The information and publications are not meant to be, and do not constitute, financial, investment, trading, or other types of advice or recommendations supplied or endorsed by TradingView. Read more in the Terms of Use.
Disclaimer
The information and publications are not meant to be, and do not constitute, financial, investment, trading, or other types of advice or recommendations supplied or endorsed by TradingView. Read more in the Terms of Use.