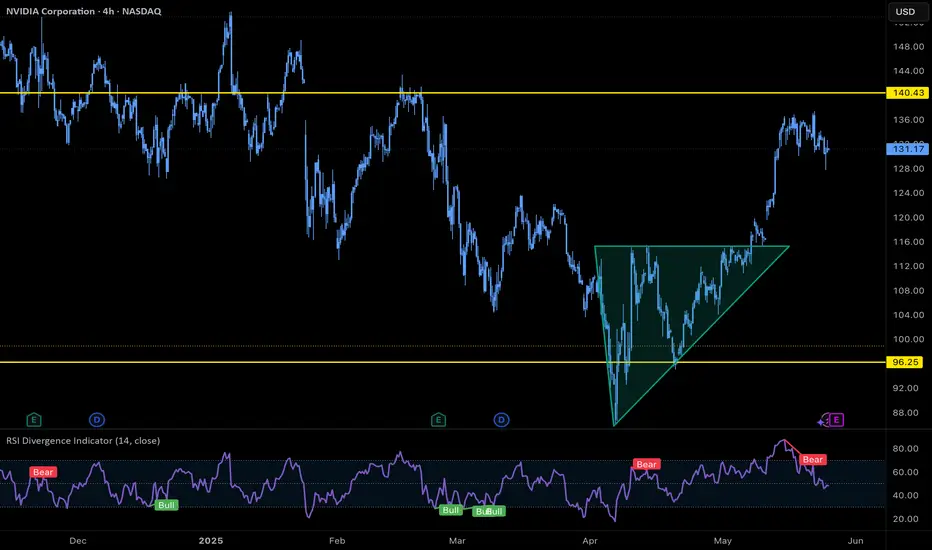
NVDA just broke and retested an ascending triangle on the 4H chart — a textbook bullish continuation pattern.
After plunging more than 40% from its highs, NVDA is now pressing higher, setting its sights on the $140 resistance zone — which also lines up closely with the 78.6% Fibonacci retracement level drawn from the all-time high to the swing low at $86.
🟢 Bullish case: We’re seeing clean structure, breakout volume, and a successful retest of prior resistance as new support.
🔴 Bearish divergence: RSI is flashing a potential warning — price is climbing, but momentum is cooling off.
With earnings on the 28th and $140 looming above, this is a must-watch chart. NVDA was the media darling of 2023–2024, and now it’s quietly building steam while most aren’t paying attention.
Could we be setting up for a run back to all-time highs — while the herd sleeps?
📊 Watchlist this one. This move could impact the entire semiconductor sector. NVDA
NVDA
After plunging more than 40% from its highs, NVDA is now pressing higher, setting its sights on the $140 resistance zone — which also lines up closely with the 78.6% Fibonacci retracement level drawn from the all-time high to the swing low at $86.
🟢 Bullish case: We’re seeing clean structure, breakout volume, and a successful retest of prior resistance as new support.
🔴 Bearish divergence: RSI is flashing a potential warning — price is climbing, but momentum is cooling off.
With earnings on the 28th and $140 looming above, this is a must-watch chart. NVDA was the media darling of 2023–2024, and now it’s quietly building steam while most aren’t paying attention.
Could we be setting up for a run back to all-time highs — while the herd sleeps?
📊 Watchlist this one. This move could impact the entire semiconductor sector.
Trade active
Could we be setting up for a run back to all-time highs — while the herd sleeps?The answer is yes so far!
Disclaimer
The information and publications are not meant to be, and do not constitute, financial, investment, trading, or other types of advice or recommendations supplied or endorsed by TradingView. Read more in the Terms of Use.
Disclaimer
The information and publications are not meant to be, and do not constitute, financial, investment, trading, or other types of advice or recommendations supplied or endorsed by TradingView. Read more in the Terms of Use.