📊 NVIDIA (NVDA) – Daily Chart Technical Analysis
Entry Point:
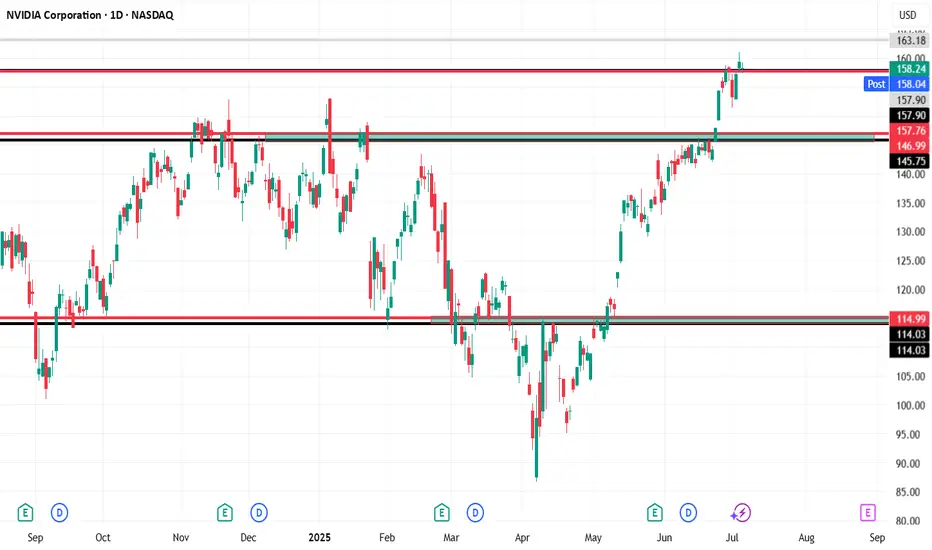
A long position is considered at $158, assuming the price holds above $157.78.
Resistance & Target:
The first target is set at $163, which is a clear resistance zone on the chart based on historical price reactions.
If momentum continues beyond that, higher targets could be considered in future analysis.
Stop Loss:
A tight stop-loss is placed just below key support at $157 to manage risk.
🔄 Weekly Bearish Scenario:
If the price closes below $157, this invalidates the bullish setup:
The first downside target would be $146, which is a previously established support zone.
A further drop could extend toward $115, especially if broader market weakness or sector rotation occurs.
📌 Key Technical Zones:
Support Zones: $157.78, $157.00 (critical for bullish continuation)
Resistance Zones: $158.12, $163.18
Multiple historical rejections and price consolidations are noted near these zones, highlighting their significance.
Summary:
As long as NVDA remains above $157.78, the outlook remains bullish targeting $163. However, a confirmed breakdown below $157 could shift the sentiment sharply bearish, targeting $146 and possibly $115.
Entry Point:
A long position is considered at $158, assuming the price holds above $157.78.
Resistance & Target:
The first target is set at $163, which is a clear resistance zone on the chart based on historical price reactions.
If momentum continues beyond that, higher targets could be considered in future analysis.
Stop Loss:
A tight stop-loss is placed just below key support at $157 to manage risk.
🔄 Weekly Bearish Scenario:
If the price closes below $157, this invalidates the bullish setup:
The first downside target would be $146, which is a previously established support zone.
A further drop could extend toward $115, especially if broader market weakness or sector rotation occurs.
📌 Key Technical Zones:
Support Zones: $157.78, $157.00 (critical for bullish continuation)
Resistance Zones: $158.12, $163.18
Multiple historical rejections and price consolidations are noted near these zones, highlighting their significance.
Summary:
As long as NVDA remains above $157.78, the outlook remains bullish targeting $163. However, a confirmed breakdown below $157 could shift the sentiment sharply bearish, targeting $146 and possibly $115.
Trade active
achivedDisclaimer
The information and publications are not meant to be, and do not constitute, financial, investment, trading, or other types of advice or recommendations supplied or endorsed by TradingView. Read more in the Terms of Use.
Disclaimer
The information and publications are not meant to be, and do not constitute, financial, investment, trading, or other types of advice or recommendations supplied or endorsed by TradingView. Read more in the Terms of Use.