Let's analyze NVIDIA (NVDA) stock with a focus on your specified parallel channel from November 2023 lows to April 2025, and its current position relative to the channel's middle line.
As of Friday, June 27, 2025, at 10:18:37 PM PDT, here's a breakdown of NVDA:
**Current Price & Performance:**
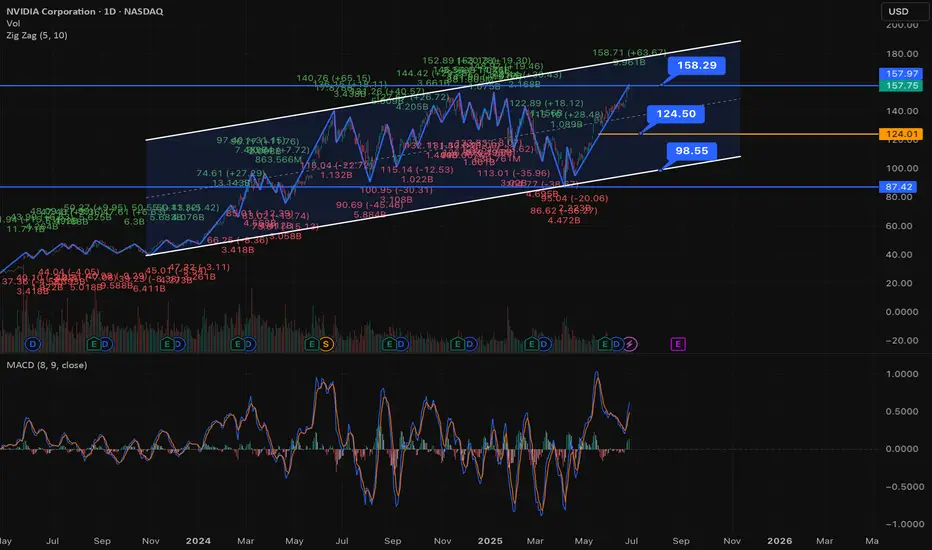
* **Last Price:** $157.75 (as of 4:00 PM ET on June 27, 2025)
* **Today's Change:** Up $2.66 (1.71%)
* **Previous Close:** $155.09
* **Today's Range:** $155.255 - $158.71 (intraday)
* **52-Week Range:** $86.63 - $158.71 (Today's high is the 52-week high, indicating a strong recent upward push and reaching new all-time highs.)
---
### **Parallel Channel Analysis (Nov 2023 Lows to April 2025)**
A parallel channel is formed by two parallel trendlines that encompass the majority of price action.
* **Uptrend Channel:** Both lines slope upwards.
* **Middle Line:** Often drawn equidistant between the two channel lines, serving as a dynamic support/resistance level.
**Constructing the Channel (Conceptual):**
* **Bottom Line:** Drawn from a significant low in November 2023 (NVDA's 52-week low is $86.63, likely from around that timeframe or slightly later in 2024). This line would connect subsequent higher lows.
* **Top Line:** Drawn parallel to the bottom line, touching the significant highs experienced during the uptrend, extending through April 2025.
**NVIDIA's Trajectory in the Channel:**
NVIDIA has been in a **parabolic uptrend** since late 2023, driven by massive demand for its AI chips. This kind of explosive growth is highly conducive to parallel channel formations, where the price continually moves higher within defined boundaries.
* **From Nov 2023 Lows to April 2025:** NVIDIA experienced a massive rally during this period. The price would have largely stayed contained within a relatively wide, upward-sloping parallel channel.
* It would have likely bounced off the bottom trendline (support) and moved towards the top trendline (resistance) multiple times.
* The middle line would have acted as a pivot point, with the price oscillating above and below it.
**Current Position: "Price is now above the middle line."**
* **Interpretation:** The fact that the price ($157.75) is currently *above* the middle line of this parallel channel (which spanned from Nov 2023 to April 2025) is a **bullish sign**.
* When the price is in the upper half of an upward-sloping parallel channel, it indicates **stronger bullish momentum** within the established trend.
* It suggests that buyers are in control and the stock is likely heading towards the **upper trendline of the channel**, or even attempting a breakout above it, especially given its recent push to new all-time highs.
* The middle line, having been crossed to the upside, now acts as a **dynamic support level**.
---
### **Implied Trend and Next Steps (based on the channel):**
* **Continued Upside:** Being above the middle line suggests a continuation of the upward trajectory within the channel.
* **Targeting Upper Band:** The next logical target for NVDA, within the context of this channel, would be its **upper trendline**. Given NVDA's history of consistently pushing boundaries, it might even test or break above this upper trendline, potentially signaling an acceleration of the trend or a "blow-off top" (though this is not guaranteed).
* **Support:** The middle line of the channel now becomes a key support to watch on any pullbacks. A move back below it would suggest a weakening of immediate momentum or a move back to the lower half of the channel.
---
### **Overall Outlook for NVDA:**
NVIDIA is trading at **all-time highs**, which itself is a testament to its strong bullish trend. The parallel channel analysis reinforces this:
* The fact that the price is **above the middle line** of a multi-month parallel channel (Nov 2023 to April 2025) indicates **significant bullish strength and control by buyers**.
* This suggests **continued upside potential** within the channel, with the upper trendline acting as the next likely resistance/target.
* NVIDIA's fundamentals (AI dominance, strong earnings, innovation) continue to fuel this technical strength.
**Important Note:** While parallel channels are powerful tools, extreme parabolic moves can sometimes lead to channel breaks or sharp corrections. Always combine technical analysis with fundamental understanding, risk management, and your own due diligence. Given NVDA's recent surge, it's also important to consider if the stock is becoming overextended in the short term, even within a strong uptrend.
As of Friday, June 27, 2025, at 10:18:37 PM PDT, here's a breakdown of NVDA:
**Current Price & Performance:**
* **Last Price:** $157.75 (as of 4:00 PM ET on June 27, 2025)
* **Today's Change:** Up $2.66 (1.71%)
* **Previous Close:** $155.09
* **Today's Range:** $155.255 - $158.71 (intraday)
* **52-Week Range:** $86.63 - $158.71 (Today's high is the 52-week high, indicating a strong recent upward push and reaching new all-time highs.)
---
### **Parallel Channel Analysis (Nov 2023 Lows to April 2025)**
A parallel channel is formed by two parallel trendlines that encompass the majority of price action.
* **Uptrend Channel:** Both lines slope upwards.
* **Middle Line:** Often drawn equidistant between the two channel lines, serving as a dynamic support/resistance level.
**Constructing the Channel (Conceptual):**
* **Bottom Line:** Drawn from a significant low in November 2023 (NVDA's 52-week low is $86.63, likely from around that timeframe or slightly later in 2024). This line would connect subsequent higher lows.
* **Top Line:** Drawn parallel to the bottom line, touching the significant highs experienced during the uptrend, extending through April 2025.
**NVIDIA's Trajectory in the Channel:**
NVIDIA has been in a **parabolic uptrend** since late 2023, driven by massive demand for its AI chips. This kind of explosive growth is highly conducive to parallel channel formations, where the price continually moves higher within defined boundaries.
* **From Nov 2023 Lows to April 2025:** NVIDIA experienced a massive rally during this period. The price would have largely stayed contained within a relatively wide, upward-sloping parallel channel.
* It would have likely bounced off the bottom trendline (support) and moved towards the top trendline (resistance) multiple times.
* The middle line would have acted as a pivot point, with the price oscillating above and below it.
**Current Position: "Price is now above the middle line."**
* **Interpretation:** The fact that the price ($157.75) is currently *above* the middle line of this parallel channel (which spanned from Nov 2023 to April 2025) is a **bullish sign**.
* When the price is in the upper half of an upward-sloping parallel channel, it indicates **stronger bullish momentum** within the established trend.
* It suggests that buyers are in control and the stock is likely heading towards the **upper trendline of the channel**, or even attempting a breakout above it, especially given its recent push to new all-time highs.
* The middle line, having been crossed to the upside, now acts as a **dynamic support level**.
---
### **Implied Trend and Next Steps (based on the channel):**
* **Continued Upside:** Being above the middle line suggests a continuation of the upward trajectory within the channel.
* **Targeting Upper Band:** The next logical target for NVDA, within the context of this channel, would be its **upper trendline**. Given NVDA's history of consistently pushing boundaries, it might even test or break above this upper trendline, potentially signaling an acceleration of the trend or a "blow-off top" (though this is not guaranteed).
* **Support:** The middle line of the channel now becomes a key support to watch on any pullbacks. A move back below it would suggest a weakening of immediate momentum or a move back to the lower half of the channel.
---
### **Overall Outlook for NVDA:**
NVIDIA is trading at **all-time highs**, which itself is a testament to its strong bullish trend. The parallel channel analysis reinforces this:
* The fact that the price is **above the middle line** of a multi-month parallel channel (Nov 2023 to April 2025) indicates **significant bullish strength and control by buyers**.
* This suggests **continued upside potential** within the channel, with the upper trendline acting as the next likely resistance/target.
* NVIDIA's fundamentals (AI dominance, strong earnings, innovation) continue to fuel this technical strength.
**Important Note:** While parallel channels are powerful tools, extreme parabolic moves can sometimes lead to channel breaks or sharp corrections. Always combine technical analysis with fundamental understanding, risk management, and your own due diligence. Given NVDA's recent surge, it's also important to consider if the stock is becoming overextended in the short term, even within a strong uptrend.
Disclaimer
The information and publications are not meant to be, and do not constitute, financial, investment, trading, or other types of advice or recommendations supplied or endorsed by TradingView. Read more in the Terms of Use.
Disclaimer
The information and publications are not meant to be, and do not constitute, financial, investment, trading, or other types of advice or recommendations supplied or endorsed by TradingView. Read more in the Terms of Use.