I noted a bull flag on  TSLA and noticed
  NVDA following the same style.
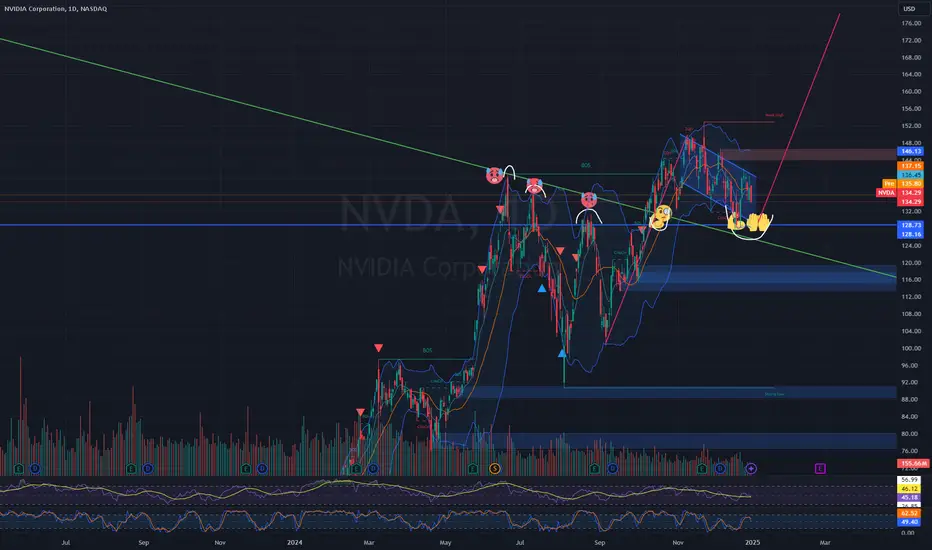
This looks like a strong flagpole through what was previously ATH resistance down trend.
Downtrend has now acted as support twice. Im hoping the 3rd time will be the charm ;)
Looking forNVDA 150Cs and TSLA 550Cs on next YUGE green day ie (SPY 2%+)
-Prophecies (Stay Patient)
PS: Apologies if chart isnt as clean as others. I'm trying to incorporate emojis to symbolize what I see as critical points, which set up critical line/levels, which then set up technical pattern. This is the way...
This looks like a strong flagpole through what was previously ATH resistance down trend.
Downtrend has now acted as support twice. Im hoping the 3rd time will be the charm ;)
Looking for
-Prophecies (Stay Patient)
PS: Apologies if chart isnt as clean as others. I'm trying to incorporate emojis to symbolize what I see as critical points, which set up critical line/levels, which then set up technical pattern. This is the way...
Trade active
It's reached a very interesting spot here. Looks like flag breakout, but I (us) can not trust without overall markets confirming.If I had to bet, this is a "dead cat bounce" on the markets, and a bull trap for
waiting on #YUGE
-Few
PS: if you scalped the resistance breakout CUDOS
Trade closed: target reached
COME TO HANDS! ;)-Prophecies
Note
At Hands lolNote
Did you buy hands?!Disclaimer
The information and publications are not meant to be, and do not constitute, financial, investment, trading, or other types of advice or recommendations supplied or endorsed by TradingView. Read more in the Terms of Use.
Disclaimer
The information and publications are not meant to be, and do not constitute, financial, investment, trading, or other types of advice or recommendations supplied or endorsed by TradingView. Read more in the Terms of Use.