We're seeing a compelling case for continued upward momentum in NVDA, but it's crucial to understand the different layers of the trend and key resistance levels.
Macro Trend: The Expanding Bullish Channel
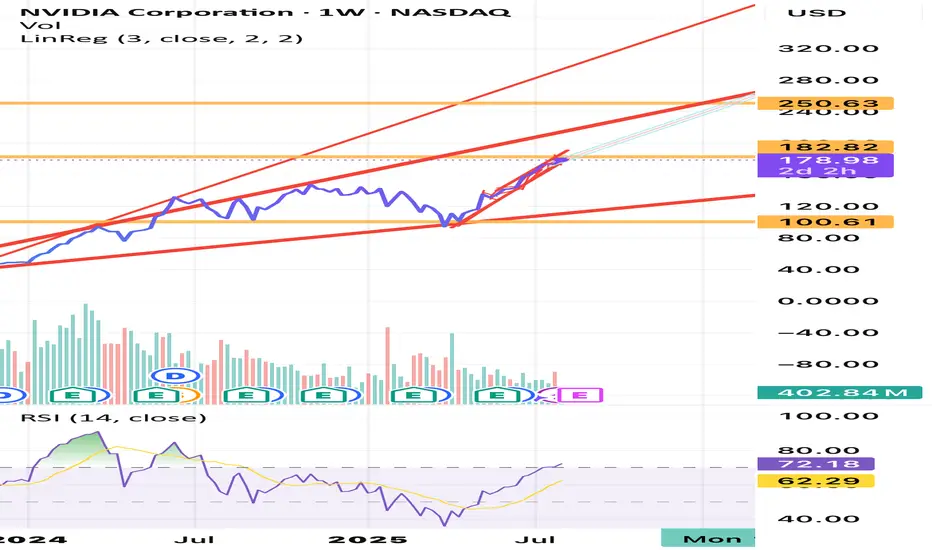
On the weekly timeframe, a larger expanding bullish channel has been forming. The price is currently near the top of this larger channel, which could act as a significant resistance level. This gives us a long-term context for the stock's current price action.
Micro Trend: The 'Small' Bullish Channel
Zooming in, NVDA is currently moving within a smaller, short-term bullish channel. The linear regression tool that I've created confirms this upward momentum. This smaller channel shows the real-time path buyers are following. It's a great way to see the current trend in detail and identify short-term support and resistance.
Momentum Check: The Weekly RSI
While the price action looks strong, a look at the weekly RSI (Relative Strength Index) suggests a note of caution. The RSI has been in a strong upward trend, but when comparing the current state to previous weekly RSI oversold positions, it appears the momentum could be "tapped a little harder." This might imply that the stock could experience a short-term pullback to cool off before a potential breakout, especially since we're currently close to the top of the large channel. Though I’m not necessarily seeing any pullback indicated yet, being we are currently sitting safe above the bottom of the current smaller bullish channel.
Conclusion: Key Levels to Watch
My analysis suggests that NVDA has strong upward momentum within two distinct bullish channels. I've marked various price targets that align with my charting and are designated by professionals as key levels to watch.
Macro Trend: The Expanding Bullish Channel
On the weekly timeframe, a larger expanding bullish channel has been forming. The price is currently near the top of this larger channel, which could act as a significant resistance level. This gives us a long-term context for the stock's current price action.
Micro Trend: The 'Small' Bullish Channel
Zooming in, NVDA is currently moving within a smaller, short-term bullish channel. The linear regression tool that I've created confirms this upward momentum. This smaller channel shows the real-time path buyers are following. It's a great way to see the current trend in detail and identify short-term support and resistance.
Momentum Check: The Weekly RSI
While the price action looks strong, a look at the weekly RSI (Relative Strength Index) suggests a note of caution. The RSI has been in a strong upward trend, but when comparing the current state to previous weekly RSI oversold positions, it appears the momentum could be "tapped a little harder." This might imply that the stock could experience a short-term pullback to cool off before a potential breakout, especially since we're currently close to the top of the large channel. Though I’m not necessarily seeing any pullback indicated yet, being we are currently sitting safe above the bottom of the current smaller bullish channel.
Conclusion: Key Levels to Watch
My analysis suggests that NVDA has strong upward momentum within two distinct bullish channels. I've marked various price targets that align with my charting and are designated by professionals as key levels to watch.
Disclaimer
The information and publications are not meant to be, and do not constitute, financial, investment, trading, or other types of advice or recommendations supplied or endorsed by TradingView. Read more in the Terms of Use.
Disclaimer
The information and publications are not meant to be, and do not constitute, financial, investment, trading, or other types of advice or recommendations supplied or endorsed by TradingView. Read more in the Terms of Use.