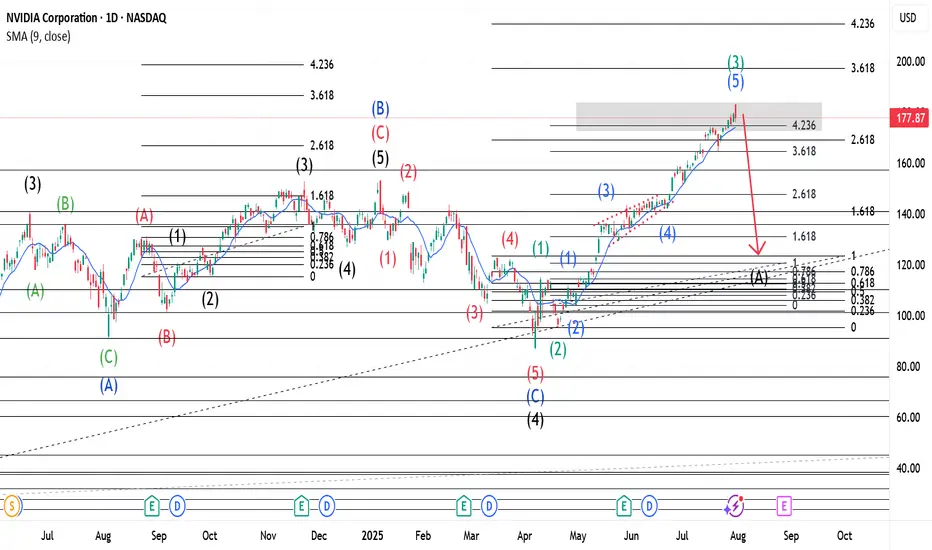
Our Wave 2(Black) of the main wave was a Zigzag hence a Flat for Wave 4(Black). When Wave 3(Black) completed a three wave move, shown in Green, was made, hence A(Blue). Wave B(Blue) went beyond the end of 3(Black) and had 3 waves, shown in Red, also(as expected for Flats). The last of this 3 wave move(Wave c-Red) had 5 waves shown in Black. Upon completion, our Wave B(Blue) was over and we expected a Wave 4(Black). Our Wave 4 made a 5 wave move(Shown in Red) that retested at the 261.8% Fib. level. With Wave C(Blue) complete, it was coined Wave 4(Black). Wave 5(Black) was launched and has a 5 wave move shown in Green. With a Zigzag for Wave 2(Green), a Flat should be expected for Wave 4(Green). Wave 3(Green) has 5 waves with a triangle for Wave 4(Blue). A confirmation at its current location(423.6% Fib. level) would mean that Wave 3(Green) is complete and a Wave A(Black) of the previously mentioned Flat should be anticipated.
NB: The placement of Wave A(Black) of the Flat mentioned above is purely for demonstrative purposes.
NB: The placement of Wave A(Black) of the Flat mentioned above is purely for demonstrative purposes.
Disclaimer
The information and publications are not meant to be, and do not constitute, financial, investment, trading, or other types of advice or recommendations supplied or endorsed by TradingView. Read more in the Terms of Use.
Disclaimer
The information and publications are not meant to be, and do not constitute, financial, investment, trading, or other types of advice or recommendations supplied or endorsed by TradingView. Read more in the Terms of Use.