🚀 NVIDIA (NVDA) 4H Setup – Rocket Booster Strategy Building Momentum After Gap-Up and Volume Spike 📈
NVIDIA (NVDA) is showing early signs of another bullish
continuation on the 4-hour chart, echoing a similar pattern seen recently on Microsoft. This setup fits well within the Rocket
Booster Strategy framework — a method focused on catching strong trend acceleration signals backed by confluence.
Here’s what’s happening on NVDA’s chart:
1. High Volume on the 4H Candle
There’s been a strong increase in volume on a bullish 4H candle, indicating significant interest at current levels. This suggests
accumulation or breakout positioning, typically a good sign ahead of momentum bursts.
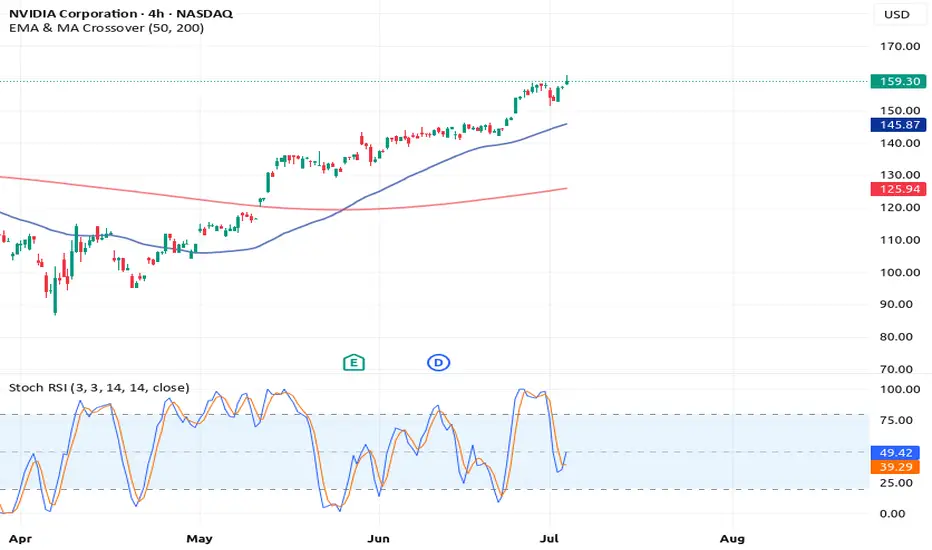
2. Stochastic RSI Between 50 and 20
While the Stochastic RSI hasn’t bounced from the oversold zone yet, it’s hovering between 50 and 20 — a zone that often acts as a
launching point for continued upward momentum. This shows that buyers are gradually regaining control without being overextended.
3. Price Above the 50 EMA and 200 EMA
NVDA is currently trading well above both the 50 EMA and 200 EMA on the 4-hour chart. This bullish structure confirms a strong
underlying uptrend, and it gives added confidence to long positions.
4. Bullish Gap-Up
A gap-up occurred recently, further confirming buying pressure. Gaps during trending conditions often signal the start of a new
impulsive wave, especially when backed by rising volume and clean trend structure.
Strategy Context
This is a textbook setup for the Rocket Booster Strategy, though the Stochastic RSI is not fully reset. Instead, it’s showing a more
gradual buildup of strength — which can be an early entry signal before larger players pile in.
Entry: On 4H candle continuation or brief intraday retracement
Stop Loss: Below the gap or recent support
Target: Previous swing highs or Fibonacci-based extensions
Final Thoughts
NVIDIA is showing strong signs of bullish continuation, and this could be the early stage of a new momentum phase. The
Stochastic RSI position adds a slightly different flavor to the setup
— more of a buildup than a reversal — but the overall structure remains solid. As always, risk management is key.
Let me know in the comments if you’re watching NVDA too or already in the trade. More setups like this coming soon.
🔥 Rocket Booster Strategy: Engaged for NVDA?
Disclaimer:
This analysis is for educational and informational purposes only. It does not constitute financial advice or a recommendation to buy or sell any security.
Always do your own research and consult a licensed financial advisor before making any trading decisions. Trade at your own risk.
NVIDIA (NVDA) is showing early signs of another bullish
continuation on the 4-hour chart, echoing a similar pattern seen recently on Microsoft. This setup fits well within the Rocket
Booster Strategy framework — a method focused on catching strong trend acceleration signals backed by confluence.
Here’s what’s happening on NVDA’s chart:
1. High Volume on the 4H Candle
There’s been a strong increase in volume on a bullish 4H candle, indicating significant interest at current levels. This suggests
accumulation or breakout positioning, typically a good sign ahead of momentum bursts.
2. Stochastic RSI Between 50 and 20
While the Stochastic RSI hasn’t bounced from the oversold zone yet, it’s hovering between 50 and 20 — a zone that often acts as a
launching point for continued upward momentum. This shows that buyers are gradually regaining control without being overextended.
3. Price Above the 50 EMA and 200 EMA
NVDA is currently trading well above both the 50 EMA and 200 EMA on the 4-hour chart. This bullish structure confirms a strong
underlying uptrend, and it gives added confidence to long positions.
4. Bullish Gap-Up
A gap-up occurred recently, further confirming buying pressure. Gaps during trending conditions often signal the start of a new
impulsive wave, especially when backed by rising volume and clean trend structure.
Strategy Context
This is a textbook setup for the Rocket Booster Strategy, though the Stochastic RSI is not fully reset. Instead, it’s showing a more
gradual buildup of strength — which can be an early entry signal before larger players pile in.
Entry: On 4H candle continuation or brief intraday retracement
Stop Loss: Below the gap or recent support
Target: Previous swing highs or Fibonacci-based extensions
Final Thoughts
NVIDIA is showing strong signs of bullish continuation, and this could be the early stage of a new momentum phase. The
Stochastic RSI position adds a slightly different flavor to the setup
— more of a buildup than a reversal — but the overall structure remains solid. As always, risk management is key.
Let me know in the comments if you’re watching NVDA too or already in the trade. More setups like this coming soon.
🔥 Rocket Booster Strategy: Engaged for NVDA?
Disclaimer:
This analysis is for educational and informational purposes only. It does not constitute financial advice or a recommendation to buy or sell any security.
Always do your own research and consult a licensed financial advisor before making any trading decisions. Trade at your own risk.
Related publications
Disclaimer
The information and publications are not meant to be, and do not constitute, financial, investment, trading, or other types of advice or recommendations supplied or endorsed by TradingView. Read more in the Terms of Use.
Related publications
Disclaimer
The information and publications are not meant to be, and do not constitute, financial, investment, trading, or other types of advice or recommendations supplied or endorsed by TradingView. Read more in the Terms of Use.