Technical Analysis (TA)
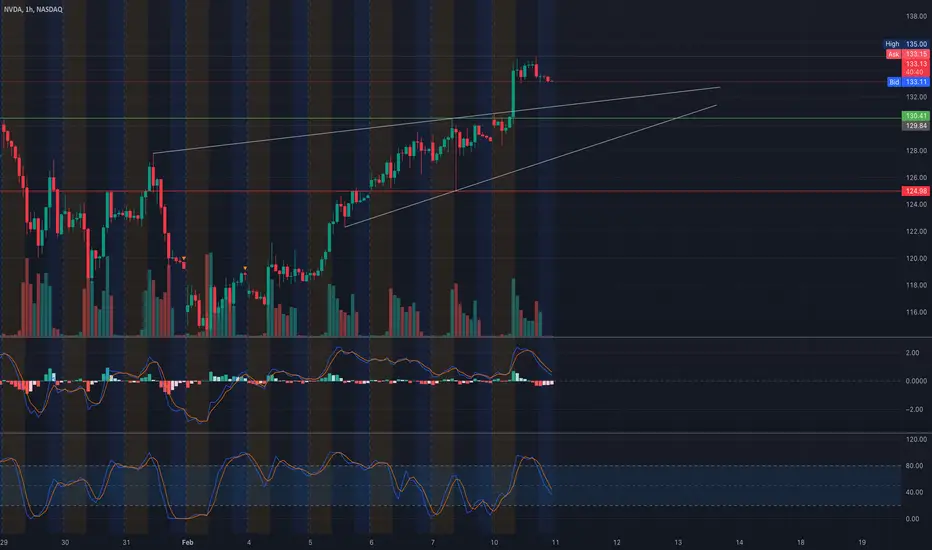
📌 Current Price: $133.15
📌 Resistance Levels:
* $135.00 (Short-term resistance)
* $140.00 (GEX Call Wall & potential breakout zone)
* $153.00 (Major resistance from past price action)
📌 Support Levels:
* $130.41 (First key support)
* $124.98 (Stronger support zone if price pulls back)
* $120.00 (Critical level near put walls)
📌 Trend Overview:
* NVDA has been trending strongly bullish, forming an ascending wedge structure.
* MACD shows momentum losing strength, suggesting potential consolidation or pullback.
* Stoch RSI is cooling off, indicating a possible dip before another leg up.
📌 Potential Price Action:
* Bullish Scenario: If NVDA breaks above $135, the next target is $140. A sustained breakout above $140 could send it to $153 in the coming weeks.
* Bearish Scenario: Failure to hold above $130 could trigger a retest of $124 or lower to $120.
Gamma Exposure (GEX) & Options Analysis

📊 IVR: 44 🔹 IVx Avg: 59.5 🔹 Call Side Dominance: 43.9% 🔹 Put Side Pressure: -5.83%
📌 Key GEX Levels:
* $140 – Strong Call Wall (Major resistance, gamma squeeze zone)
* $130 – Mild Support, watch for buyers
* $120-$118 – Highest negative GEX, strong put positioning
📌 Implication:
* Above $135, NVDA could see acceleration toward $140 due to gamma squeezes.
* A rejection at $135 might trigger a pullback to $130.
* Heavy put support around $120-$118, meaning downside could be limited unless major selling pressure emerges.
Trading Plan
💡 For Bulls:
* Entry: $135 breakout with volume
* Target 1: $140
* Target 2: $153
* Stop-loss: Below $130
💡 For Bears:
* Entry: $135 rejection with weak momentum
* Target 1: $130
* Target 2: $124
* Stop-loss: Above $136
Final Thoughts
* NVDA has strong bullish momentum but is approaching key resistance levels.
* Options flow supports bullish continuation above $135.
* Watch for volume confirmation on any breakout!
📉 Risk management is key—don’t chase breakouts without confirmation.
⚠️ Disclaimer
This analysis is for educational purposes only and does not constitute financial advice. Always conduct your own research and trade responsibly.
📌 Current Price: $133.15
📌 Resistance Levels:
* $135.00 (Short-term resistance)
* $140.00 (GEX Call Wall & potential breakout zone)
* $153.00 (Major resistance from past price action)
📌 Support Levels:
* $130.41 (First key support)
* $124.98 (Stronger support zone if price pulls back)
* $120.00 (Critical level near put walls)
📌 Trend Overview:
* NVDA has been trending strongly bullish, forming an ascending wedge structure.
* MACD shows momentum losing strength, suggesting potential consolidation or pullback.
* Stoch RSI is cooling off, indicating a possible dip before another leg up.
📌 Potential Price Action:
* Bullish Scenario: If NVDA breaks above $135, the next target is $140. A sustained breakout above $140 could send it to $153 in the coming weeks.
* Bearish Scenario: Failure to hold above $130 could trigger a retest of $124 or lower to $120.
Gamma Exposure (GEX) & Options Analysis
📊 IVR: 44 🔹 IVx Avg: 59.5 🔹 Call Side Dominance: 43.9% 🔹 Put Side Pressure: -5.83%
📌 Key GEX Levels:
* $140 – Strong Call Wall (Major resistance, gamma squeeze zone)
* $130 – Mild Support, watch for buyers
* $120-$118 – Highest negative GEX, strong put positioning
📌 Implication:
* Above $135, NVDA could see acceleration toward $140 due to gamma squeezes.
* A rejection at $135 might trigger a pullback to $130.
* Heavy put support around $120-$118, meaning downside could be limited unless major selling pressure emerges.
Trading Plan
💡 For Bulls:
* Entry: $135 breakout with volume
* Target 1: $140
* Target 2: $153
* Stop-loss: Below $130
💡 For Bears:
* Entry: $135 rejection with weak momentum
* Target 1: $130
* Target 2: $124
* Stop-loss: Above $136
Final Thoughts
* NVDA has strong bullish momentum but is approaching key resistance levels.
* Options flow supports bullish continuation above $135.
* Watch for volume confirmation on any breakout!
📉 Risk management is key—don’t chase breakouts without confirmation.
⚠️ Disclaimer
This analysis is for educational purposes only and does not constitute financial advice. Always conduct your own research and trade responsibly.
Disclaimer
The information and publications are not meant to be, and do not constitute, financial, investment, trading, or other types of advice or recommendations supplied or endorsed by TradingView. Read more in the Terms of Use.
Disclaimer
The information and publications are not meant to be, and do not constitute, financial, investment, trading, or other types of advice or recommendations supplied or endorsed by TradingView. Read more in the Terms of Use.