Nvidia 184 Calls
🔍 Pattern Analysis
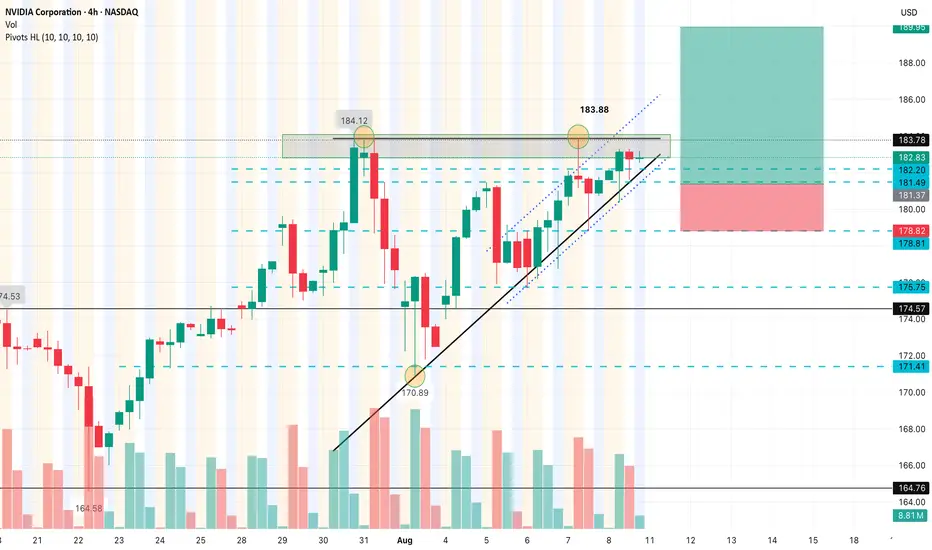
• You’ve identified an ascending triangle pattern:
• Rising trendline support (black line).
• Flat resistance near the $183.78 level (green box).
• This is a bullish continuation pattern, especially in an uptrend like NVDA has been in.
Key Levels
• Current Price: ~$182.83
• Resistance / Breakout Zone: ~$183.78 (clearly marked)
• Support Levels:
• Short-term: $182.16, $181.49
• Risk Level (Stop): ~$178.90
• Stronger Support: $175.75, $174.57
• Target (Take Profit): ~$190.03 (marked in green)
Trade Setup (Buy Breakout)
• Entry: Around the breakout of $183.78
• Stop Loss: ~$178.90 (below recent lows)
• Take Profit: ~$190.03
• Risk/Reward Ratio: Roughly 1:2, which is solid
Volume Observation
• Volume has been decreasing during consolidation, which is typical before a breakout.
• Watch for a volume spike to confirm the breakout above $183.78.
Risks & Notes
• Price is currently near resistance; wait for a confirmed breakout (candle close above $183.78).
• If it rejects this level again, a break below the ascending trendline could flip the setup bearish.
• If support at $181.49 or $178.90 breaks, NVDA could pull back toward $175 or even $171.
Final Thought
This is a bullish setup, but confirmation is key. Either:
• Enter on breakout with volume confirmation.
• Or wait for a retest of $183.78 as support after the breakout.
🔍 Pattern Analysis
• You’ve identified an ascending triangle pattern:
• Rising trendline support (black line).
• Flat resistance near the $183.78 level (green box).
• This is a bullish continuation pattern, especially in an uptrend like NVDA has been in.
Key Levels
• Current Price: ~$182.83
• Resistance / Breakout Zone: ~$183.78 (clearly marked)
• Support Levels:
• Short-term: $182.16, $181.49
• Risk Level (Stop): ~$178.90
• Stronger Support: $175.75, $174.57
• Target (Take Profit): ~$190.03 (marked in green)
Trade Setup (Buy Breakout)
• Entry: Around the breakout of $183.78
• Stop Loss: ~$178.90 (below recent lows)
• Take Profit: ~$190.03
• Risk/Reward Ratio: Roughly 1:2, which is solid
Volume Observation
• Volume has been decreasing during consolidation, which is typical before a breakout.
• Watch for a volume spike to confirm the breakout above $183.78.
Risks & Notes
• Price is currently near resistance; wait for a confirmed breakout (candle close above $183.78).
• If it rejects this level again, a break below the ascending trendline could flip the setup bearish.
• If support at $181.49 or $178.90 breaks, NVDA could pull back toward $175 or even $171.
Final Thought
This is a bullish setup, but confirmation is key. Either:
• Enter on breakout with volume confirmation.
• Or wait for a retest of $183.78 as support after the breakout.
Disclaimer
The information and publications are not meant to be, and do not constitute, financial, investment, trading, or other types of advice or recommendations supplied or endorsed by TradingView. Read more in the Terms of Use.
Disclaimer
The information and publications are not meant to be, and do not constitute, financial, investment, trading, or other types of advice or recommendations supplied or endorsed by TradingView. Read more in the Terms of Use.