Hello, traders.
If you "Follow", you can always get new information quickly.
Please click "Boost" as well.
Have a nice day today.
-------------------------------------
(1M chart)
A gap has formed in the 109.63-113.62 range.
Therefore, I think it is possible to fall to around 109.63.
Since the StochRSI indicator is showing signs of entering the oversold range, I think the area around 109.63-113.62 shows that it is an important support and resistance area.
-
(1W chart)
I think the M-Signal indicator on the 1W chart is passing through the 109.63-113.62 range, proving that this range is an important support and resistance range.
If it falls below 109.63, we should check for support near the M-Signal indicator on the 1M chart or near the HA-Low indicator on the newly created 1W chart.
- The M-Signal indicator on the 1M chart is currently passing through the 83.13 range,
- and the HA-Low indicator on the 1W chart is at the 12.77 point.
Therefore, as the price falls, it is expected that the area near the M-Signal indicator on the 1M chart will become an important support and resistance range.
-
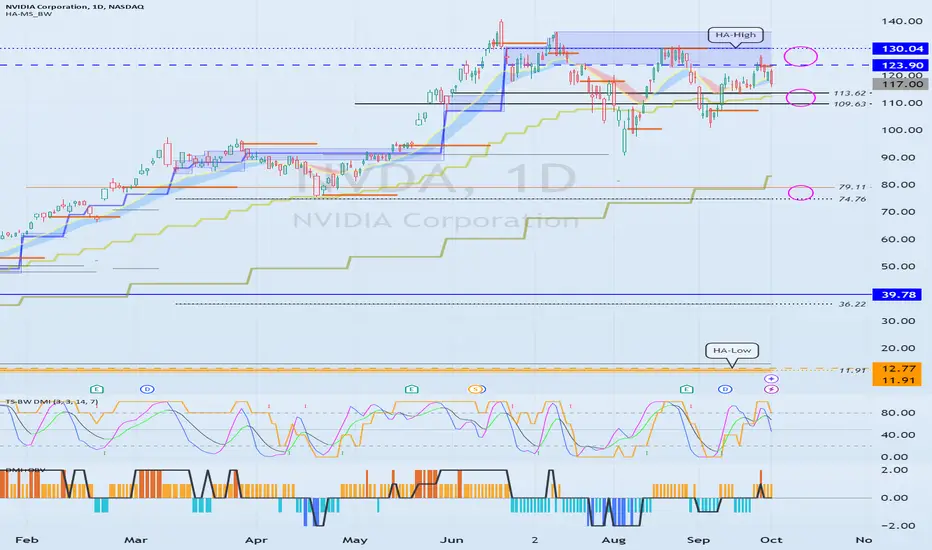
(1D chart)
The point of interest is in which direction it deviates from the 109.63-113.62 section ~ 123.90-130.04 section.
Currently, the HA-Low and HA-High indicators on the 1W and 1D charts are quite far apart.
Therefore, if it falls below 109.63, the HA-Low indicator on the 1W and 1D charts is expected to rise and be newly created.
The creation of the HA-Low indicator means that a low section has been formed.
Therefore, if the HA-Low indicator is created this time, it is expected that a movement to create a new wave will begin.
-
If it falls from the HA-High indicator, it is likely to touch the HA-Low indicator.
The creation of the HA-High indicator means that a high section has been formed.
Therefore, in order for a full-scale uptrend to begin, the price must remain above the HA-High indicator.
Therefore, when a full-scale uptrend begins, the HA-High indicator will show a stepwise uptrend.
-
Have a nice time.
Thank you.
--------------------------------------------------
Other content (coins, stocks, etc.) is frequently posted on X.
X에 다른 내용(코인, 주식 등)이 자주 게시.
◆ t.me/readCryptoChannel
[HA-MS Indicator]
bit.ly/3YxHgvN
[OBV Indicator]
bit.ly/4dcyny3
X에 다른 내용(코인, 주식 등)이 자주 게시.
◆ t.me/readCryptoChannel
[HA-MS Indicator]
bit.ly/3YxHgvN
[OBV Indicator]
bit.ly/4dcyny3
Disclaimer
The information and publications are not meant to be, and do not constitute, financial, investment, trading, or other types of advice or recommendations supplied or endorsed by TradingView. Read more in the Terms of Use.