🧠 Technical Analysis – 1H + 15M Chart
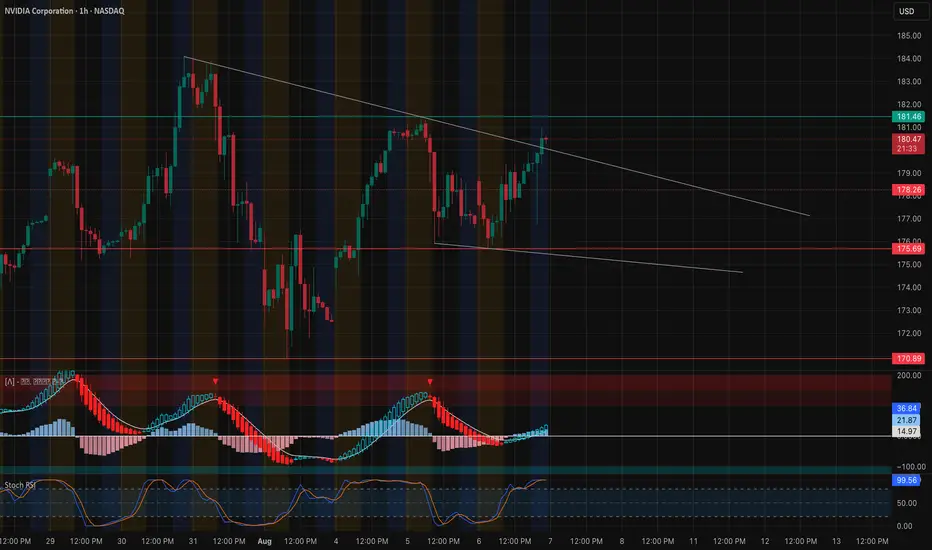
NVDA is testing the upper bound of a symmetrical triangle on the 1-hour chart — a critical spot that could either break for continuation or reject back into the wedge.
* Trendline resistance from previous highs is pressing NVDA around 180.80–181.50.
* Stochastic RSI is overheated (>99), suggesting a potential pullback or fakeout before true breakout strength.
* MACD is crossing bullish with increasing histogram momentum — short-term buyers are stepping in.
On the 15-minute chart, we see:
* Tight coil forming near 181.00.
* Minor resistance at 181.46 from previous rejection.
* A bullish breakout above 182.00 on volume would confirm a short-term rally.
⚠️ Keep an eye for a potential fakeout above trendline and reversal back below 179.70 — a CHoCH could trap late bulls.
💥 GEX + Options Sentiment (Based on 1H Chart)

* GEX Map shows massive resistance forming around 182.5–185, with:
* 57.12% Call Wall at 182.5
* 51.68% Call Wall at 185
* Gamma is heavily concentrated just above current price — strong dealer hedging could cap upside moves if flow doesn't increase.
* Support Zones:
* 175 → Put support and HVL level
* 172.5 → Cluster of downside GEX risk (-7.23%)
* IVR is at 19.3 (low), with Call flow only at 3.4% — suggesting institutions are not aggressively chasing upside here.
🎯 Trade Scenarios
Bullish Breakout Setup
* ✅ Entry: Above 182.00 breakout
* 🎯 Target: 184.20 → 185.50
* 🛑 Stop: Below 179.50 or re-entry inside triangle
Bearish Rejection Setup
* 🔻 Entry: Rejection from 181.50–182.00 zone
* 🎯 Target: 178.20 → 175
* 🛑 Stop: Above 182.30
My Thoughts: NVDA is at a decision point — either break out and squeeze through GEX walls or get trapped and fade to lower support zones. Volume and reaction at 182 will be key. This is a high-risk area for chasers — ideal zone for scalpers and short-term breakout traders with tight stops.
Disclaimer: This analysis is for educational purposes only and does not constitute financial advice. Always do your own research and manage your risk accordingly.
NVDA is testing the upper bound of a symmetrical triangle on the 1-hour chart — a critical spot that could either break for continuation or reject back into the wedge.
* Trendline resistance from previous highs is pressing NVDA around 180.80–181.50.
* Stochastic RSI is overheated (>99), suggesting a potential pullback or fakeout before true breakout strength.
* MACD is crossing bullish with increasing histogram momentum — short-term buyers are stepping in.
On the 15-minute chart, we see:
* Tight coil forming near 181.00.
* Minor resistance at 181.46 from previous rejection.
* A bullish breakout above 182.00 on volume would confirm a short-term rally.
⚠️ Keep an eye for a potential fakeout above trendline and reversal back below 179.70 — a CHoCH could trap late bulls.
💥 GEX + Options Sentiment (Based on 1H Chart)
* GEX Map shows massive resistance forming around 182.5–185, with:
* 57.12% Call Wall at 182.5
* 51.68% Call Wall at 185
* Gamma is heavily concentrated just above current price — strong dealer hedging could cap upside moves if flow doesn't increase.
* Support Zones:
* 175 → Put support and HVL level
* 172.5 → Cluster of downside GEX risk (-7.23%)
* IVR is at 19.3 (low), with Call flow only at 3.4% — suggesting institutions are not aggressively chasing upside here.
🎯 Trade Scenarios
Bullish Breakout Setup
* ✅ Entry: Above 182.00 breakout
* 🎯 Target: 184.20 → 185.50
* 🛑 Stop: Below 179.50 or re-entry inside triangle
Bearish Rejection Setup
* 🔻 Entry: Rejection from 181.50–182.00 zone
* 🎯 Target: 178.20 → 175
* 🛑 Stop: Above 182.30
My Thoughts: NVDA is at a decision point — either break out and squeeze through GEX walls or get trapped and fade to lower support zones. Volume and reaction at 182 will be key. This is a high-risk area for chasers — ideal zone for scalpers and short-term breakout traders with tight stops.
Disclaimer: This analysis is for educational purposes only and does not constitute financial advice. Always do your own research and manage your risk accordingly.
Disclaimer
The information and publications are not meant to be, and do not constitute, financial, investment, trading, or other types of advice or recommendations supplied or endorsed by TradingView. Read more in the Terms of Use.
Disclaimer
The information and publications are not meant to be, and do not constitute, financial, investment, trading, or other types of advice or recommendations supplied or endorsed by TradingView. Read more in the Terms of Use.