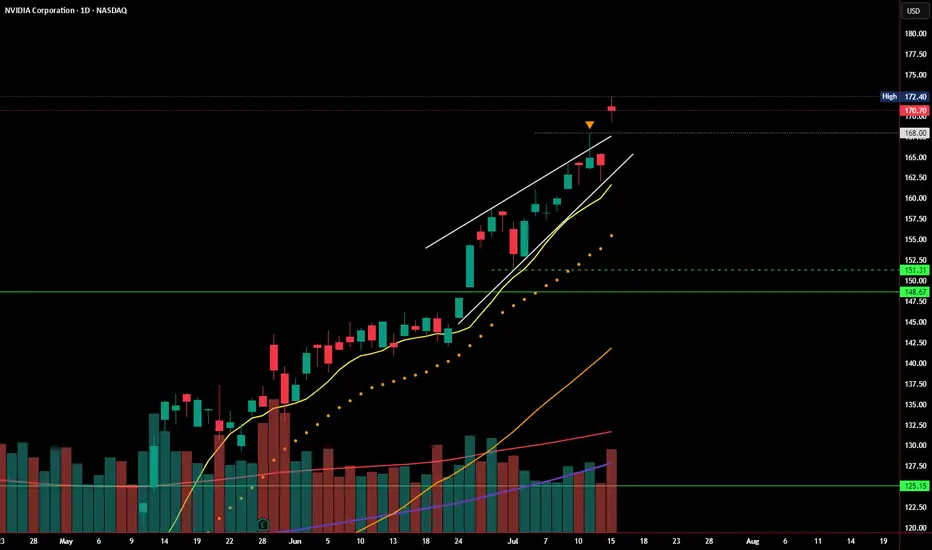
In my last post, I highlighted the rising wedge pattern forming at the top of NVDA’s strong rally. Price briefly pushed above the upper wedge resistance and tagged $172.40, but today’s session printed a bearish close at $170.70 — just above the breakout level, but with no real follow-through.
Volume came in higher, but price action failed to extend the breakout, suggesting this could be a stall or even a false breakout in progress. RSI remains overbought, and momentum may be slowing despite the recent push.
If price slips back below $168, we could see the original wedge breakdown scenario come back into play. Watch for support around:
🔹 $151.31–148.67
🔹 Below that: $125 zone
For bulls, continuation above $172.40 with strong volume would invalidate this pattern and confirm breakout strength. Until then, caution is warranted.
Related publications
Disclaimer
The information and publications are not meant to be, and do not constitute, financial, investment, trading, or other types of advice or recommendations supplied or endorsed by TradingView. Read more in the Terms of Use.
Related publications
Disclaimer
The information and publications are not meant to be, and do not constitute, financial, investment, trading, or other types of advice or recommendations supplied or endorsed by TradingView. Read more in the Terms of Use.