NVIDIA (NVDA) – Elliott Wave + Fib Confluence Forecast | 2025/26 Outlook
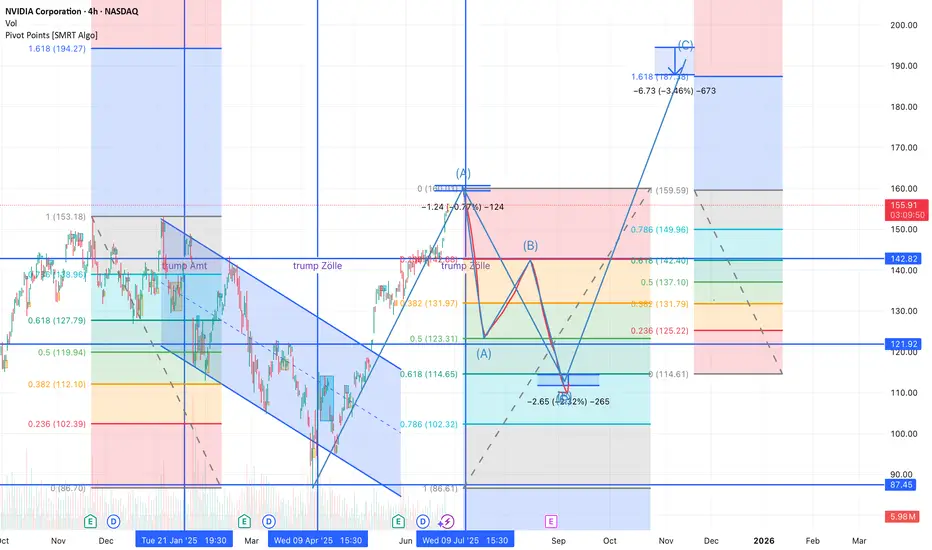
After a textbook falling wedge breakout and bullish retest, NVIDIA is now completing a potential (A)-(B)-(C) correction wave structure. Here's the detailed outlook:
🧠 Technical Structure & Price Zones
The (A) wave may have topped near 159.59, with strong Fib confluence zones (2.618–4.236) and a visible rejection.
A sharp (A) down leg is projected to test the Fib 0.618–0.786 support between 114–102 USD, aligning with a historical demand zone and key structural low.
A corrective (B) bounce could reach up to ~142 USD, which is the 0.618 retracement of the projected fall.
The final (C) wave may target the 1.618 extension around 187–190 USD, suggesting a potential year-end rally if the wave structure unfolds as expected.
These may again align with wave turning points, particularly around July and September 2025.
📊 Fibonacci Clusters
Numerous Fib confluences were detected using the full wave stack (retracements, extensions, projections).
Watch the 121.92 and 142.82 horizontal zones — both are strong Fib overlaps and historical pivot levels.
Blue vertical lines indicate potential turning windows.
📌 Conclusion: A high-probability ABC correction pattern seems to be forming. Once Wave (B) completes, a final impulsive push toward ~190 USD could occur before a larger correction sets in. Monitor macro headlines and price behavior near Fib zones.
💬 Let me know your thoughts below — bullish, bearish, or neutral? Always happy to discuss wave setups!
Disclaimer
The information and publications are not meant to be, and do not constitute, financial, investment, trading, or other types of advice or recommendations supplied or endorsed by TradingView. Read more in the Terms of Use.
Disclaimer
The information and publications are not meant to be, and do not constitute, financial, investment, trading, or other types of advice or recommendations supplied or endorsed by TradingView. Read more in the Terms of Use.