Nvidia (NVDA) Share Price Soars to Record High
Yesterday, Nvidia’s (NVDA) share price surged by over 4%, with the following key developments:
→ It broke through the psychological $150 per share level;
→ It reached a new all-time high;
→ It also contributed to the Nasdaq 100 index hitting a record peak, as we reported earlier this morning.
As a result, Nvidia has reclaimed its status as the world’s most valuable company. Demand for its shares is being fuelled by the CEO’s optimism.
“We have many growth opportunities across our company, with AI and robotics the two largest, representing a multitrillion-dollar growth opportunity,” said Jensen Huang at Nvidia’s annual investor conference.

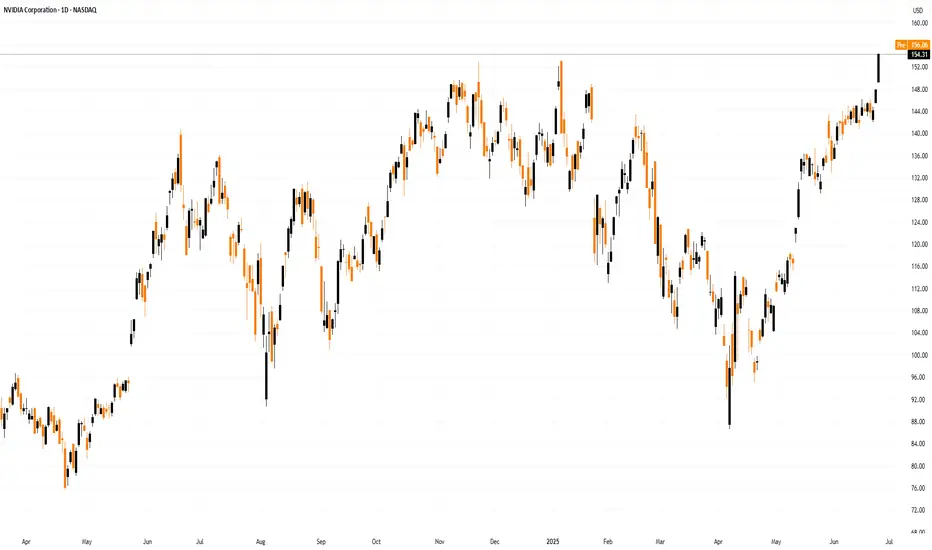
Technical Analysis of the NVDA Chart
The last three candlesticks reflect strong demand, as:
→ There are bullish gaps between the candles;
→ Lower wicks are either absent or minimal;
→ Candles are closing near their highs with progressively widening spreads.
This suggests strong momentum as the price confidently breaks through the key $150 resistance level. It is reasonable to assume that the current imbalance in favour of buyers around the $146–150 area (highlighted in purple) may form a support zone in the event of a pullback — for instance, within the existing upward channel (shown in blue).
This article represents the opinion of the Companies operating under the FXOpen brand only. It is not to be construed as an offer, solicitation, or recommendation with respect to products and services provided by the Companies operating under the FXOpen brand, nor is it to be considered financial advice.
Yesterday, Nvidia’s (NVDA) share price surged by over 4%, with the following key developments:
→ It broke through the psychological $150 per share level;
→ It reached a new all-time high;
→ It also contributed to the Nasdaq 100 index hitting a record peak, as we reported earlier this morning.
As a result, Nvidia has reclaimed its status as the world’s most valuable company. Demand for its shares is being fuelled by the CEO’s optimism.
“We have many growth opportunities across our company, with AI and robotics the two largest, representing a multitrillion-dollar growth opportunity,” said Jensen Huang at Nvidia’s annual investor conference.
Technical Analysis of the NVDA Chart
The last three candlesticks reflect strong demand, as:
→ There are bullish gaps between the candles;
→ Lower wicks are either absent or minimal;
→ Candles are closing near their highs with progressively widening spreads.
This suggests strong momentum as the price confidently breaks through the key $150 resistance level. It is reasonable to assume that the current imbalance in favour of buyers around the $146–150 area (highlighted in purple) may form a support zone in the event of a pullback — for instance, within the existing upward channel (shown in blue).
This article represents the opinion of the Companies operating under the FXOpen brand only. It is not to be construed as an offer, solicitation, or recommendation with respect to products and services provided by the Companies operating under the FXOpen brand, nor is it to be considered financial advice.
Disclaimer
The information and publications are not meant to be, and do not constitute, financial, investment, trading, or other types of advice or recommendations supplied or endorsed by TradingView. Read more in the Terms of Use.
Disclaimer
The information and publications are not meant to be, and do not constitute, financial, investment, trading, or other types of advice or recommendations supplied or endorsed by TradingView. Read more in the Terms of Use.