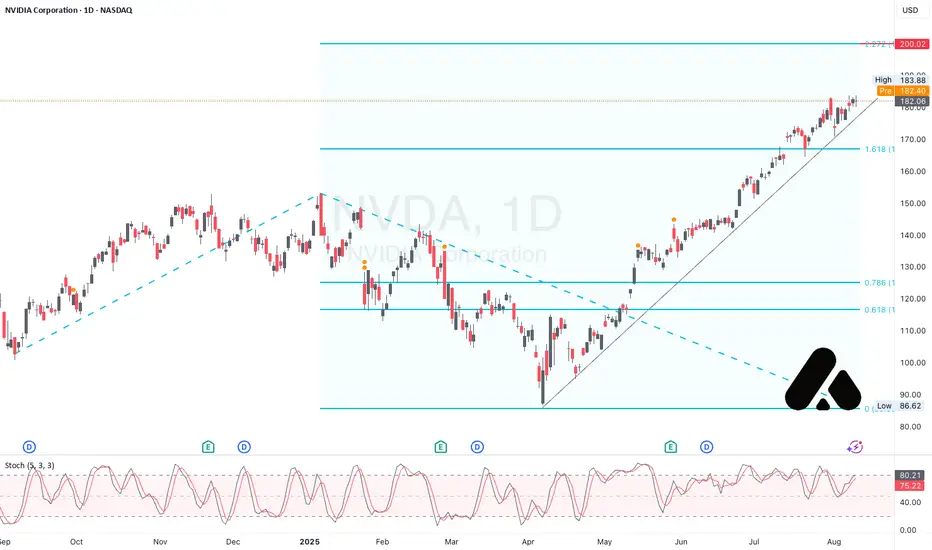
NVDA keeps pushing towards $200 major resistance area, a very good momentum showed by a clear bullish trendline and stochastic momentum. No sign of bearish yet but still we've seen a slow but steady gain over the last couple days. Trend-based fibonacci is used to project the target price for NVDA. Short-term downward momentum might appear, however if NVDA isn't break down the 1.618 fibonacci level ($165-$170 price range) from the previous trend-based fibonacci, we could say that NVDA still remain bullish. Stop loss is optional on that level.
Disclaimer
The information and publications are not meant to be, and do not constitute, financial, investment, trading, or other types of advice or recommendations supplied or endorsed by TradingView. Read more in the Terms of Use.
Disclaimer
The information and publications are not meant to be, and do not constitute, financial, investment, trading, or other types of advice or recommendations supplied or endorsed by TradingView. Read more in the Terms of Use.