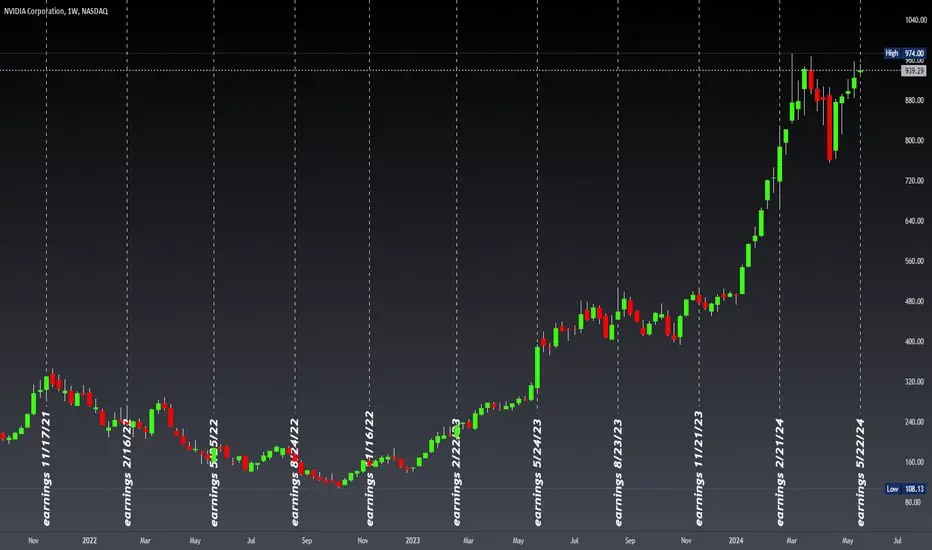
NVDA earnings stats based on the last 10 earnings days close to following day close.
11/17/21
293 - 317
+ 24 = + 8%
2/16/22
265 - 245
- 20 = - 9%
5/25/22
170 - 179
+ 9 = + 5%
8/24/22
172 - 179
+ 7 = + 4%
11/16/22
159 - 157
- 2 = - 1%
2/22/23
208 - 237
+ 29 = + 14%
5/24/23
305 - 380
+ 75 = + 25%
8/23/23
471 - 472
+ 1 = na %
11/21/23
499 - 487
- 12 = - 2%
2/21/24
675 - 785
+ 110 = + 16%
5/22/24 ?
10 earnings
average = + 6%
high = + 25%
low = - 9%
5/24/24 expiry options data:
Put Volume Total 144,889
Call Volume Total 221,403
Put/Call Volume Ratio 0.65
Put Open Interest Total 145,386
Call Open Interest Total 180,269
Put/Call Open Interest Ratio 0.81
Highest OI Call strike = 950
Highest OI Put strike = 920
IV implied move = +/- 9%
Note
NVDAshort 1144
profit 1100
stop 1155
Note
I closed short at 1110Note
NVDAshort 1194
profit 1144
stop 1204
Note
Note
Note
Note
Trading indicators:
tradingview.com/u/Options360/
tradingview.com/u/Options360/
Disclaimer
The information and publications are not meant to be, and do not constitute, financial, investment, trading, or other types of advice or recommendations supplied or endorsed by TradingView. Read more in the Terms of Use.