Technical Analysis Summary – NVO
After a prolonged downtrend, the stock established a potential reversal structure:
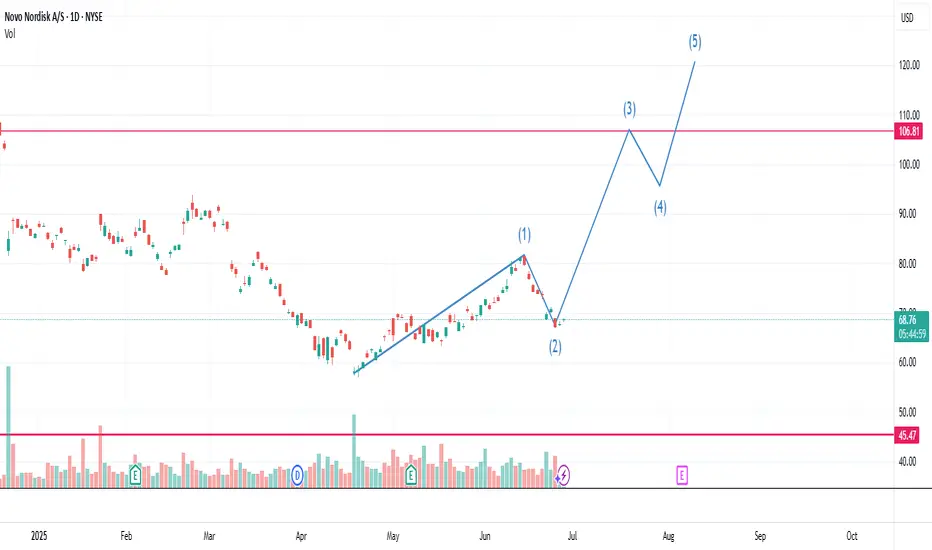
Wave 1: Initial impulsive rally, marking the first significant move against the prevailing bearish trend.
Wave 2: Healthy corrective pullback that retraced precisely to the 61.8% Fibonacci level of Wave 1, which is a classic depth for a Wave 2 retracement in Elliott Wave Theory.
The price also tested and bounced off the 200-day Simple Moving Average (SMA) on the first attempt, confirming this zone as key technical support.
A hidden bullish divergence formed: while the price created a higher low, the momentum indicator (RSI) printed a lower low. This suggests that sellers exhausted their strength and the primary trend may resume.
Premarket action showed the stock trading about +2% higher, indicating early buying interest and potential momentum continuation.
The projected target for Wave 3, assuming the scenario unfolds, is approximately $107, derived from the 161.8% Fibonacci extension of Wave 1. This also coincides with historically important resistance.
Overall, this setup combines:
✅ A clear Elliott Wave structure (Wave 1-2-3),
✅ Confluence of major support levels (61.8% retracement and the 200-day SMA),
✅ A hidden bullish divergence signaling continuation,
✅ A strong premarket move suggesting institutional interest,
✅ And supportive fundamentals behind the price action.
This is an example of a technically robust scenario with favorable risk/reward characteristics. Traders will watch for confirmation through volume expansion and a breakout above recent swing highs to validate the start of Wave 3.
After a prolonged downtrend, the stock established a potential reversal structure:
Wave 1: Initial impulsive rally, marking the first significant move against the prevailing bearish trend.
Wave 2: Healthy corrective pullback that retraced precisely to the 61.8% Fibonacci level of Wave 1, which is a classic depth for a Wave 2 retracement in Elliott Wave Theory.
The price also tested and bounced off the 200-day Simple Moving Average (SMA) on the first attempt, confirming this zone as key technical support.
A hidden bullish divergence formed: while the price created a higher low, the momentum indicator (RSI) printed a lower low. This suggests that sellers exhausted their strength and the primary trend may resume.
Premarket action showed the stock trading about +2% higher, indicating early buying interest and potential momentum continuation.
The projected target for Wave 3, assuming the scenario unfolds, is approximately $107, derived from the 161.8% Fibonacci extension of Wave 1. This also coincides with historically important resistance.
Overall, this setup combines:
✅ A clear Elliott Wave structure (Wave 1-2-3),
✅ Confluence of major support levels (61.8% retracement and the 200-day SMA),
✅ A hidden bullish divergence signaling continuation,
✅ A strong premarket move suggesting institutional interest,
✅ And supportive fundamentals behind the price action.
This is an example of a technically robust scenario with favorable risk/reward characteristics. Traders will watch for confirmation through volume expansion and a breakout above recent swing highs to validate the start of Wave 3.
Disclaimer
The information and publications are not meant to be, and do not constitute, financial, investment, trading, or other types of advice or recommendations supplied or endorsed by TradingView. Read more in the Terms of Use.
Disclaimer
The information and publications are not meant to be, and do not constitute, financial, investment, trading, or other types of advice or recommendations supplied or endorsed by TradingView. Read more in the Terms of Use.