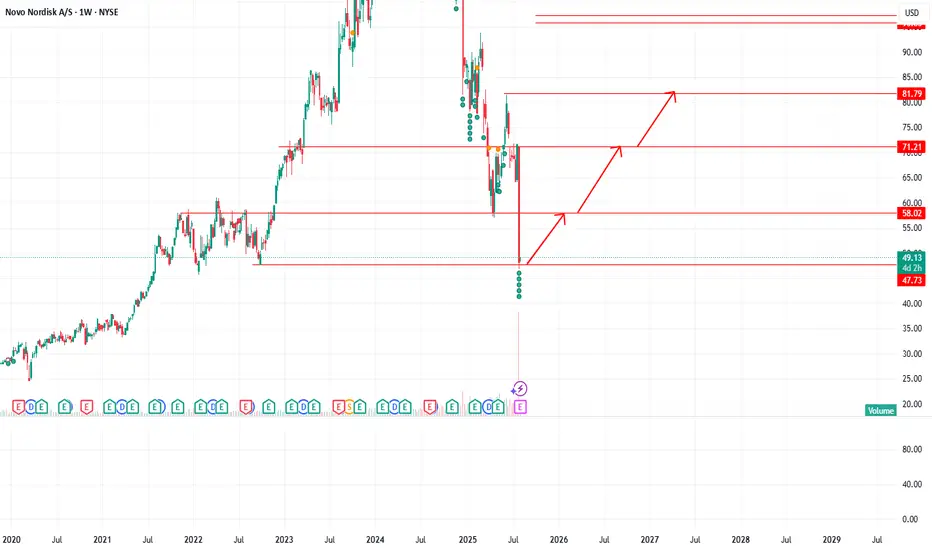
Novo Nordisk (NVO) recently saw a sharp drop with heavy volume, signaling strong selling pressure. The chart shows a potential recovery path if the stock holds support near $47.
🔄 Possible rebound levels:
First target: $58
Mid target: $71
Final target: $82
📊 Options flow shows strong call activity (bullish bets), with a low put/call ratio, suggesting some traders expect a bounce. However, momentum is still weak, and if $47 fails, further downside toward $36 or lower is possible.
Disclaimer
The information and publications are not meant to be, and do not constitute, financial, investment, trading, or other types of advice or recommendations supplied or endorsed by TradingView. Read more in the Terms of Use.
Disclaimer
The information and publications are not meant to be, and do not constitute, financial, investment, trading, or other types of advice or recommendations supplied or endorsed by TradingView. Read more in the Terms of Use.