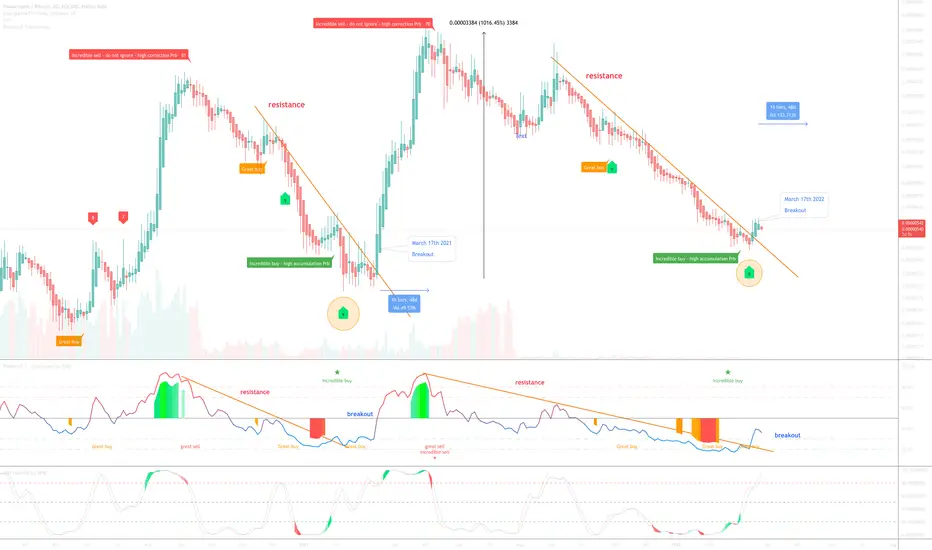
On the above 3-day chart price action has corrected over 90% since the sell signal in May 2021. Now is an excellent moment to be bullish. First off a big shout out to bL1TZZ for alerting me on this one.
Why bullish? There’s so much going on with this chart I could talk about it for an hours..
1) The ‘incredible buy’ signal prints.
2) Price action and RSI resistance breakout.
3) Bullish divergence. Lots of it. 9 oscillators are currently printing positive divergence. (Orange circles).
The Fractal -
4) Price action resistance broke out on March 17th. This happened 1 year ago exactly on March 17th 2021! What??
The dollar chart is just as bullish with a ‘incredible buy’ printing on the 5-day chart (below).
Is it possible for price action to fall further? For sure.
Is it probable? Very unlikely.
Target? 10x as before like last year.
Good luck!
Ww
PS: I’m not trading this, leave a comment below if you want an update.
5-day USD chart - “Incredible buy”
Trade active
Note
Price action has made a near 50% move since publishing a few days ago, fantastic. Expect some profit taking. The 12hr chart is printing a 'great sell' signal. Look for support before going long.
Trade active
Note
The main chart in this idea had my indicator set to 'stocks' instead of 'crypto' and gave a false IB signal. Apologies!This is the same chart but now set to 'Crypto'
Note
A bearish divergence might be forming as price action nears past resistance. Notice stochastic RSI turning red? Note
23 cent area on dollar chart is resistance BTC
bc1q2eckdzh0q8vsd7swcc8et6ze7s99khhxyl7zwy
Weblink: patreon.com/withoutworries
Allow 3-6 months on ideas. Not investment advice. DYOR
bc1q2eckdzh0q8vsd7swcc8et6ze7s99khhxyl7zwy
Weblink: patreon.com/withoutworries
Allow 3-6 months on ideas. Not investment advice. DYOR
Disclaimer
The information and publications are not meant to be, and do not constitute, financial, investment, trading, or other types of advice or recommendations supplied or endorsed by TradingView. Read more in the Terms of Use.
BTC
bc1q2eckdzh0q8vsd7swcc8et6ze7s99khhxyl7zwy
Weblink: patreon.com/withoutworries
Allow 3-6 months on ideas. Not investment advice. DYOR
bc1q2eckdzh0q8vsd7swcc8et6ze7s99khhxyl7zwy
Weblink: patreon.com/withoutworries
Allow 3-6 months on ideas. Not investment advice. DYOR
Disclaimer
The information and publications are not meant to be, and do not constitute, financial, investment, trading, or other types of advice or recommendations supplied or endorsed by TradingView. Read more in the Terms of Use.