Long
Nexus Could Double In Value Soon
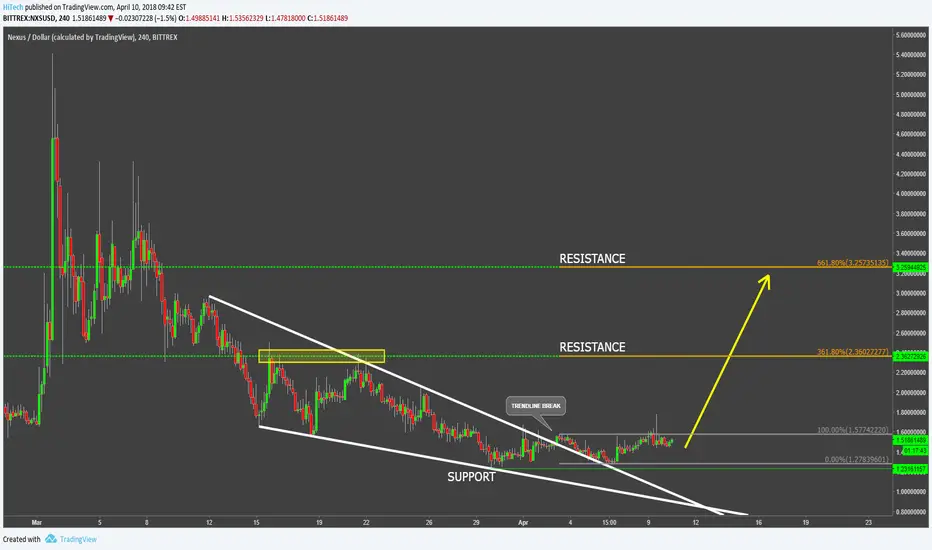
After hitting the low at $1.2, Nexus went up and broke above the triangle pattern. But then it consolidated for a while and now seem ready to start producing higher highs and higher lows.
Fibonacci applied to the corrective wave down after the downtrend trendline breakout, shows that the nearest strong resistance is at 361.8% retracement level, that is $2.3. Although if that resistance is broken the next upside target could be at $3.25.
In the worst case scenario NXS/USD could go back down to the downtrend trendline before moving upwards, although the recent spike up shows more of a bullish intentions in the short term.
Trade closed: target reached
Note
Resistance brokenNote
nexus could be going for the second target nowTrade closed: target reached
Disclaimer
The information and publications are not meant to be, and do not constitute, financial, investment, trading, or other types of advice or recommendations supplied or endorsed by TradingView. Read more in the Terms of Use.
Disclaimer
The information and publications are not meant to be, and do not constitute, financial, investment, trading, or other types of advice or recommendations supplied or endorsed by TradingView. Read more in the Terms of Use.