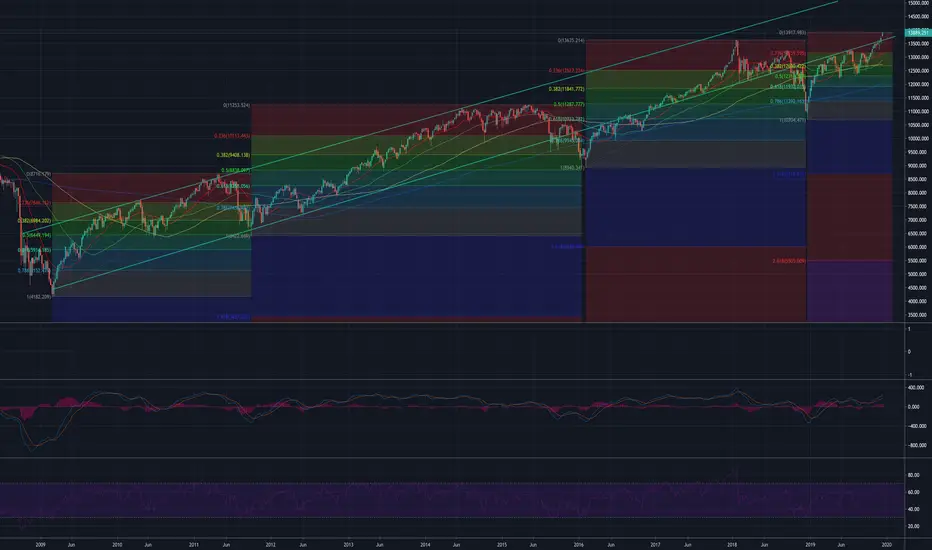
This is a chart of the NYSE since March 2009 the beginning of the current bull market. The NYSE Composite has made new highs in the last couple weeks and has finally breached the underside of the control line for the first time since last year's sell-off. I broke the chart into four time periods that represent the beginning of a run to its peak and through its correction using FIB retracement. The total gain over the last 11 years has been roughly 330% - very impressive for a basket of 1900 stocks. Looking at each of the four time periods the first run saw prices climb 108% before a 50% retracement. The second run saw prices climb 75% with again a nearly 50% retracement. The third run saw prices rise 52% and a 61.8% retracement (the largest of the retracements). The fourth run that we are currently in has seen prices climb 30%, and has finally made it above the control line and back into the channel that it fell out of last year. What does this all mean? I'm not sure but what I do see from looking at the numbers is that each successive run is having smaller and smaller percentage gains. This is in part due to the fact that we are in year 11 of a super bull market and the law of large numbers will prevent those percentages from expanding as prices rise. Taking a look at absolute gains, the first run was a 4,500 point gain, the second was a 4,800 point gain, the third was a 4,700 point gain, and the fourth so far has been a 3210 point gain. I'm not sure if we will see something in the 4.500 point range for this run but if we do that would imply a move over the 15,000 area or so which would push this index to the top end of the channel. Based on market sentiment, greed index, VIX and the factors it does not seem likely that this would occur but at the end of blow off tops all bets are off and anything can happen. Looking at RSI, with the exception of the beginning of 2018 where RSI hit a peak of nearly 90, this indicator has stayed between 30 and 70 with no wavering. We are at the top end of that range right now and I would anticipate that a turn is coming soon. We went from 30 at last year's bottom to 70 through 12 months. How long it takes to get back down to 30 is anyone's guess but what I suspect is that we are getting really close to this index rolling over and what may be looked back upon as a double top when all is said and done. I truly believe without the FED stimulus the last month this market would have already rolled over. Mr. Greenspan's term irrational exuberance could not be more applicable than it is right now. AMD has not had a down week since September. Nothing has changed but the stock is up 60% during that time and absolutely nothing has changed with their story. Chips are leading the melt up and will have to start the meltdown. Look at MU's results this week relative to last year's numbers.....down remarkably and continuing in that direction despite the CEO attempting to say that this last quarter marked a bottom. Something is out there. Not sure what it is but when it hits it will be extraordinary and something we will all say ..... Oh Yeah, that was obvious!
Disclaimer
The information and publications are not meant to be, and do not constitute, financial, investment, trading, or other types of advice or recommendations supplied or endorsed by TradingView. Read more in the Terms of Use.
Disclaimer
The information and publications are not meant to be, and do not constitute, financial, investment, trading, or other types of advice or recommendations supplied or endorsed by TradingView. Read more in the Terms of Use.