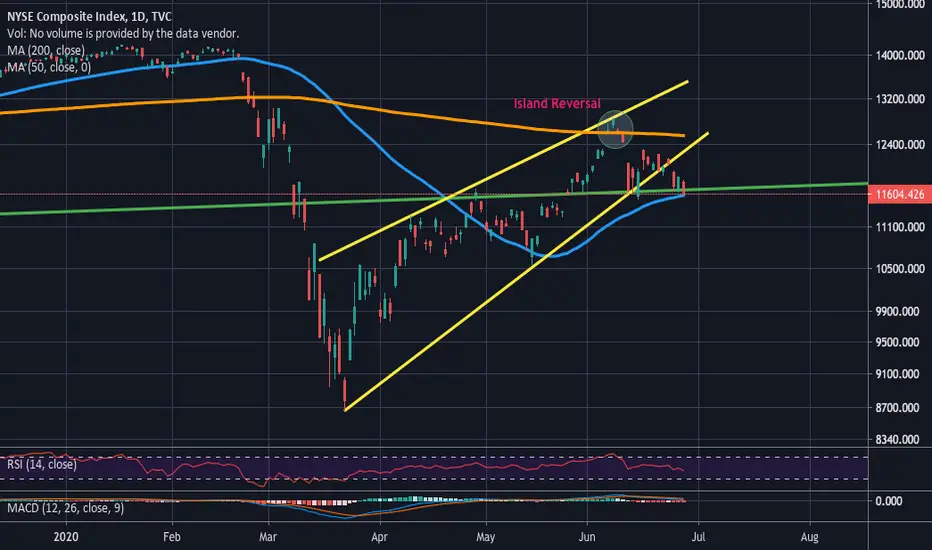
Much like the major indices, the stocks on the New York Stock Exchange formed a rising wedge from the March lows which has since broken down. And, also like the other indices, it produced an island reversal top from June 5th through the 10th.
Though it has found support on the 50-day simple moving average (blue), it remains far below the 200-day simple moving average (orange).
One far more bearish characteristic is that on Friday, it closed below an eight-year trend line (green).
Once this cracks the 50-day, look for strong selling.
Though it has found support on the 50-day simple moving average (blue), it remains far below the 200-day simple moving average (orange).
One far more bearish characteristic is that on Friday, it closed below an eight-year trend line (green).
Once this cracks the 50-day, look for strong selling.
Disclaimer
The information and publications are not meant to be, and do not constitute, financial, investment, trading, or other types of advice or recommendations supplied or endorsed by TradingView. Read more in the Terms of Use.
Disclaimer
The information and publications are not meant to be, and do not constitute, financial, investment, trading, or other types of advice or recommendations supplied or endorsed by TradingView. Read more in the Terms of Use.