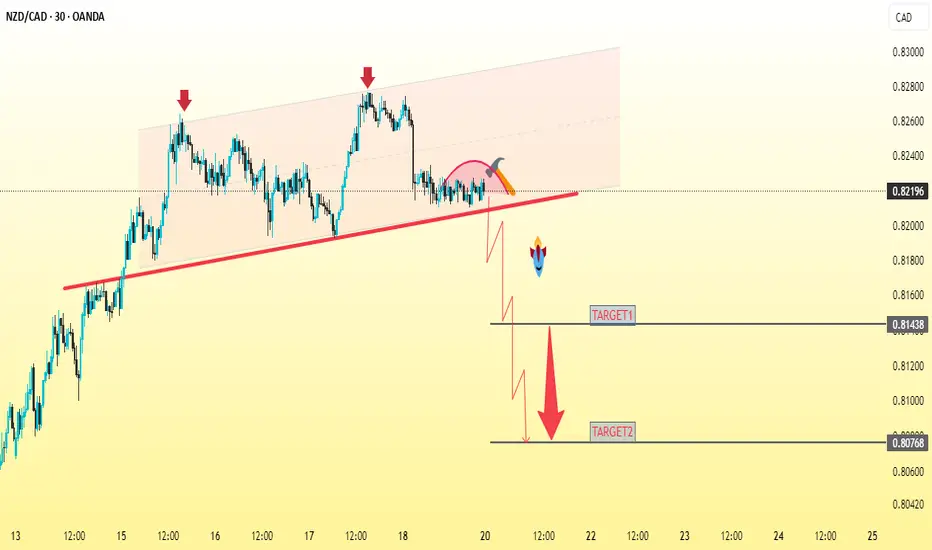
NZD/CAD Chart Analysis (30m TF)
Market Outlook: Bearish
Entry Point:
Sell at 0.82192 (current price zone marked with horizontal line and price tag)
Take Profit Targets:
TP1: 0.81483 (first horizontal support line)
Final TP: 0.80768 (second and lower support zone)
Support Levels:
0.81483 — Minor support (first target)
0.80768 — Strong support (final target area)
Resistance Level:
0.82192 — Immediate resistance (entry point zone)
Minor intraday resistance near 0.82350 (local highs)
Technical Observation:
Price formed a lower high and is consolidating below resistance.
Bearish breakout setup drawn with projection to the downside.
Confirmation to sell upon clear breakdown below support area and continuation pattern forming.
Disclaimer
The information and publications are not meant to be, and do not constitute, financial, investment, trading, or other types of advice or recommendations supplied or endorsed by TradingView. Read more in the Terms of Use.
Disclaimer
The information and publications are not meant to be, and do not constitute, financial, investment, trading, or other types of advice or recommendations supplied or endorsed by TradingView. Read more in the Terms of Use.