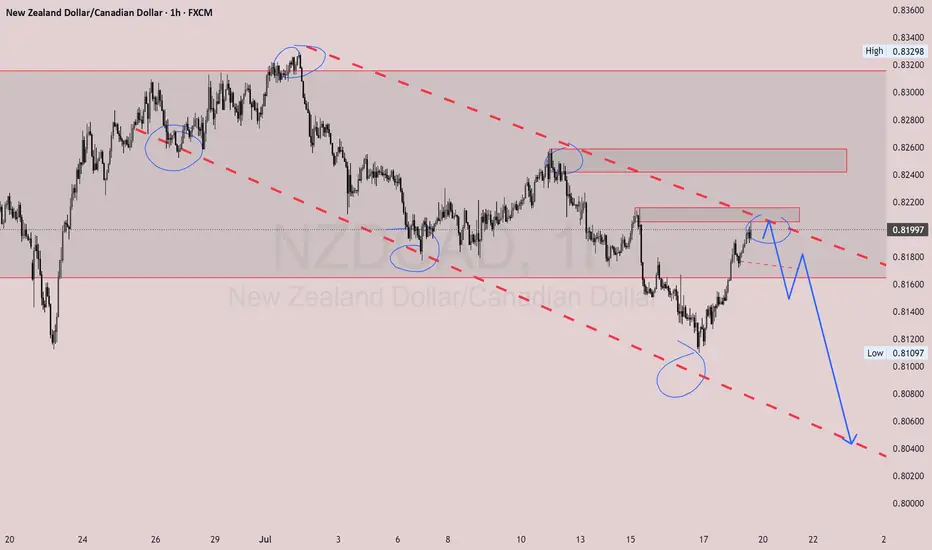
This is a 1-hour chart of NZDCAD, and you’ve clearly marked a descending channel with multiple respected touches on both trendlines — showing clean market structure.
Analysis:
- Price is approaching the upper boundary of the descending channel again.
- There’s a potential supply zone just above current price.
- The blue projection suggests a possible rejection from that upper zone, continuing the overall bearish trend.
- Repeated reactions at the channel edges signal strong technical respect.
What to Do Next:
- Wait for bearish confirmation (e.g. rejection wick, bearish engulfing) at the upper trendline/supply zone.
- If confirmed, enter a sell trade with targets toward the lower boundary of the channel.
- Place stop-loss just above the supply zone or last swing high.
Suggested Caption for Social Media:
"NZDCAD playing beautifully within this descending channel. Watching closely for a bearish reaction at this key zone. Patience is power in trading. Let the market speak. 📉🔥 #ForexAnalysis #NZDCAD #PriceAction #SmartTrading"
Let me know if you want it in a more casual or motivational tone.
Disclaimer
The information and publications are not meant to be, and do not constitute, financial, investment, trading, or other types of advice or recommendations supplied or endorsed by TradingView. Read more in the Terms of Use.
Disclaimer
The information and publications are not meant to be, and do not constitute, financial, investment, trading, or other types of advice or recommendations supplied or endorsed by TradingView. Read more in the Terms of Use.