NZDCAD at Resistance: Will the Bearish Pattern Repeat?
NZDCAD at Resistance: Will the Bearish Pattern Repeat?
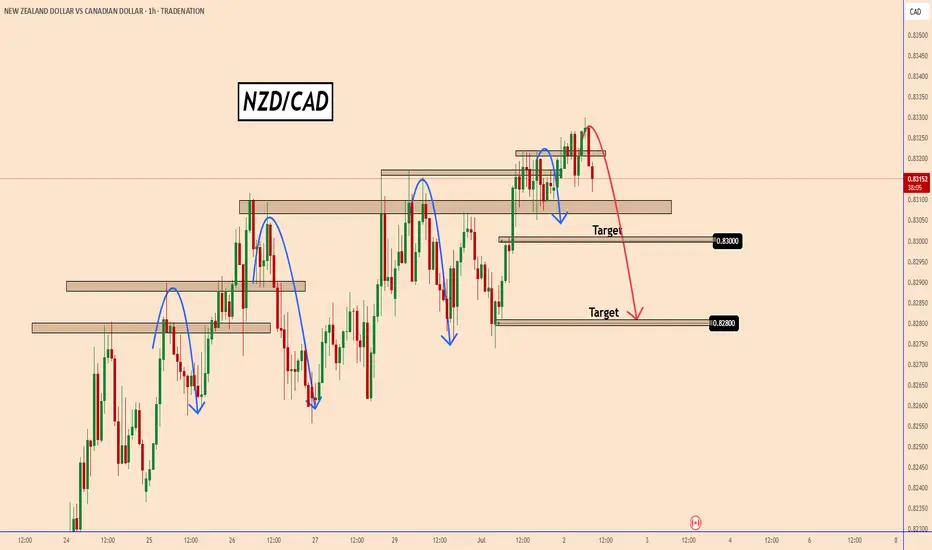
NZDCAD has faced a strong resistance zone, and it shows no signs of a clear direction.
Looking to the left side of the chart, we can observe that despite occasional upward movements, the pair has repeatedly followed a similar bearish pattern.
This repeated behavior suggests that the current setup may once again lead to a downside move.
If history repeats itself, NZDCAD could initiate another bearish wave from this zone, potentially targeting the 0.8300 and 0.8280 levels.
You may find more details in the chart!
Thank you and Good Luck!
PS: Please support with a like or comment if you find this analysis useful for your trading day
Disclosure: I am part of Trade Nation's Influencer program and receive a monthly fee for using their TradingView charts in my analysis.
Note
Note
Trade closed: target reached
✅MY Free Signals
t.me/TradingPuzzles
✅Personal Telegram
t.me/KlejdiCuni
✅YouTube
youtube.com/@TradingPuzzles
✅MY Recommended Broker is TRADE NATION
🔸bit.ly/49VySJF
t.me/TradingPuzzles
✅Personal Telegram
t.me/KlejdiCuni
✅YouTube
youtube.com/@TradingPuzzles
✅MY Recommended Broker is TRADE NATION
🔸bit.ly/49VySJF
Disclaimer
The information and publications are not meant to be, and do not constitute, financial, investment, trading, or other types of advice or recommendations supplied or endorsed by TradingView. Read more in the Terms of Use.