NZDCAD – 15M Technical & Fundamental Analysis
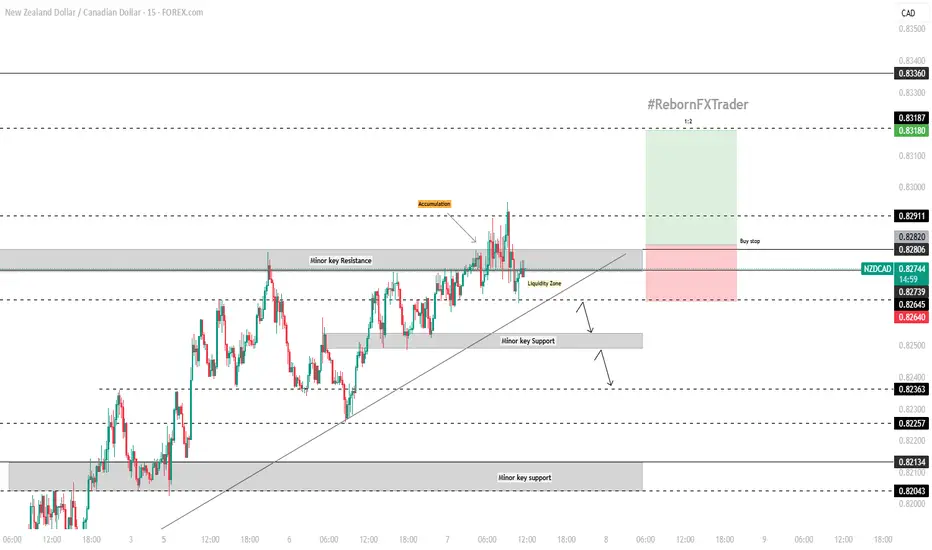
On the 15-minute chart, NZDCAD has been consistently forming higher highs and higher lows, showing bullish momentum until price reached and broke through the minor key resistance at 0.82800.
Following the breakout, price accumulated buy orders above this level, forming a liquidity trap. After the accumulation phase, the market moved downward into the liquidity zone to hunt for stop orders. Now, price is showing signs of recovery and is preparing for a potential breakout move.
Our area of interest lies at 0.82820 for a buy stop entry, joining the bullish momentum.
Our risk management is placed at 0.82640 (below the liquidity zone), and the target is a potential move toward 0.90650.
Fundamental Analysis:
Positive NZD News:
New Zealand’s Unemployment Rate came in stronger than expected at 5.1% (forecast: 5.3%), indicating a healthier labor market. This supports NZD strength and investor sentiment.
Weak CAD Outlook:
The Canadian Dollar remains pressured due to disappointing economic indicators, including sluggish growth and weakening oil prices—both of which tend to weigh heavily on the CAD.
Moreover, the Bank of Canada’s dovish stance has reduced expectations for any immediate tightening, further dampening the CAD's appeal.
Summary:
With bullish technical structure and positive fundamentals supporting the NZD, alongside a softening CAD outlook, NZDCAD is well-positioned for a continued upward move. Traders may monitor price action closely near 0.82820 for a potential breakout opportunity.
📌 Disclaimer:
This is not financial advice. As always, wait for proper confirmation before executing trades. Manage your risk wisely and trade what you see, not what you feel.
Disclaimer
The information and publications are not meant to be, and do not constitute, financial, investment, trading, or other types of advice or recommendations supplied or endorsed by TradingView. Read more in the Terms of Use.
Disclaimer
The information and publications are not meant to be, and do not constitute, financial, investment, trading, or other types of advice or recommendations supplied or endorsed by TradingView. Read more in the Terms of Use.