Hey traders,
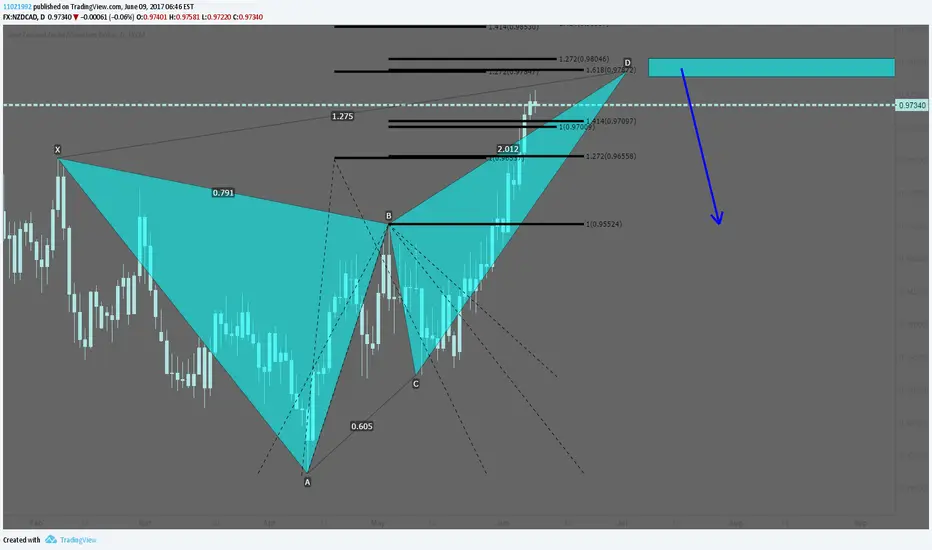
On the daily NZDCAD we can see a potential bearish butterfly pattern taking shape on the daily timeframe. It completes at the 127.2% and 161.8% Fibonacci extension.
Let's see how this works out!
On the daily NZDCAD we can see a potential bearish butterfly pattern taking shape on the daily timeframe. It completes at the 127.2% and 161.8% Fibonacci extension.
Let's see how this works out!
Related publications
Disclaimer
The information and publications are not meant to be, and do not constitute, financial, investment, trading, or other types of advice or recommendations supplied or endorsed by TradingView. Read more in the Terms of Use.
Related publications
Disclaimer
The information and publications are not meant to be, and do not constitute, financial, investment, trading, or other types of advice or recommendations supplied or endorsed by TradingView. Read more in the Terms of Use.