📌 Instrument & Timeframe
NZD/CAD – 4H timeframe
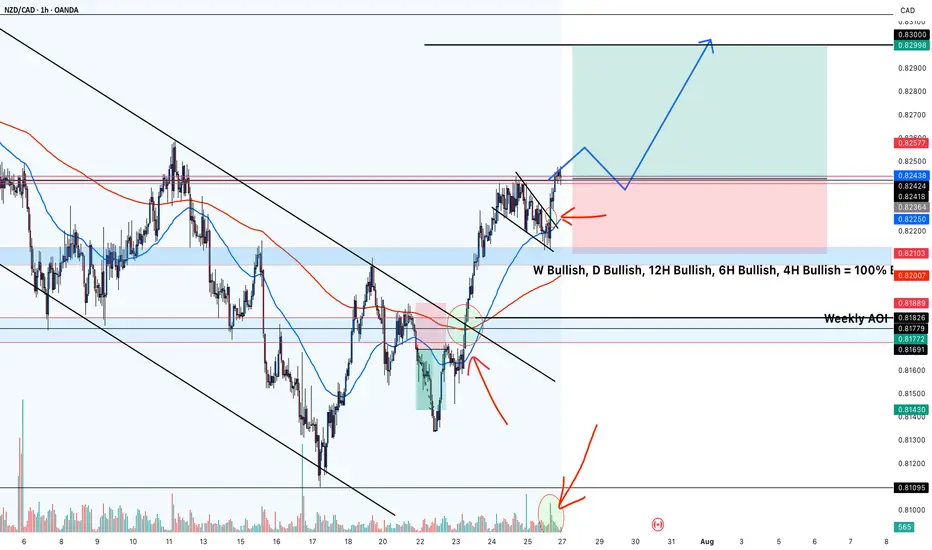
Overall trend across multiple timeframes is noted as bullish (W, D, 12H, 6H, 4H all bullish).
📈 Market Structure
Price previously moved within a descending channel (drawn by two black trendlines) but has broken out to the upside.
After the breakout, price retraced back near a key area (just above the 200 EMA / red line) and is forming a smaller bull flag or descending wedge, indicating a potential continuation.
🔥 Area of Interest
Weekly AOI (Area of Interest) marked around 0.8180 – 0.8200 zone has acted as strong support.
Price reacted bullishly from that AOI, confirming buyers stepped in.
✅ Trade Bias
All higher timeframes (W, D, 12H, 6H, 4H) are bullish, so the bias is long.
NZD/CAD – 4H timeframe
Overall trend across multiple timeframes is noted as bullish (W, D, 12H, 6H, 4H all bullish).
📈 Market Structure
Price previously moved within a descending channel (drawn by two black trendlines) but has broken out to the upside.
After the breakout, price retraced back near a key area (just above the 200 EMA / red line) and is forming a smaller bull flag or descending wedge, indicating a potential continuation.
🔥 Area of Interest
Weekly AOI (Area of Interest) marked around 0.8180 – 0.8200 zone has acted as strong support.
Price reacted bullishly from that AOI, confirming buyers stepped in.
✅ Trade Bias
All higher timeframes (W, D, 12H, 6H, 4H) are bullish, so the bias is long.
Disclaimer
The information and publications are not meant to be, and do not constitute, financial, investment, trading, or other types of advice or recommendations supplied or endorsed by TradingView. Read more in the Terms of Use.
Disclaimer
The information and publications are not meant to be, and do not constitute, financial, investment, trading, or other types of advice or recommendations supplied or endorsed by TradingView. Read more in the Terms of Use.