✅ Detailed Technical Conclusion (Based on H4 Chart & Indicators)
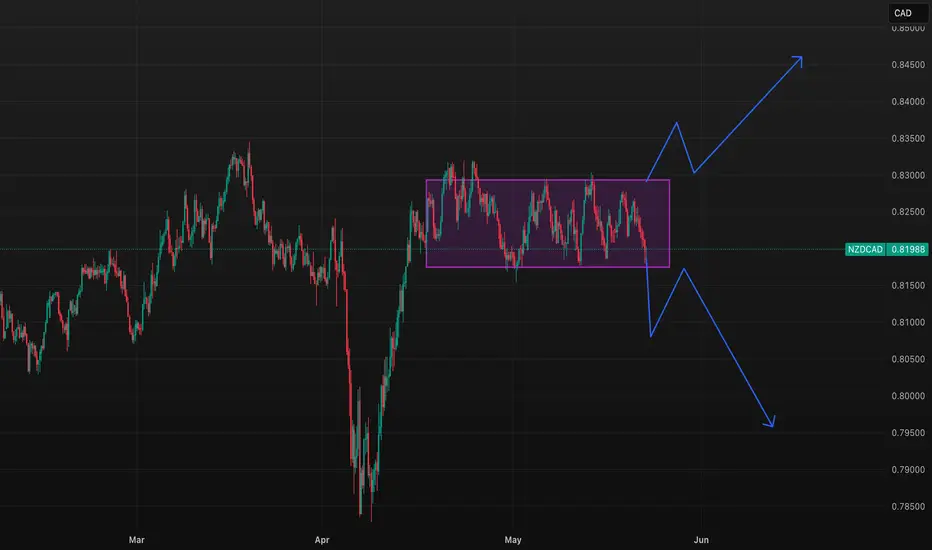
The NZD/CAD pair is currently trading near the bottom of a well-defined range between 0.81800 and 0.83000, representing a major horizontal support level that has been respected multiple times over recent weeks.
Despite the broad bearish sentiment reflected in the moving averages (all indicating Sell) and momentum indicators like MACD and Momentum (10), several important reversal signals are starting to emerge:
🔍 Bullish Reversal Clues
Commodity Channel Index (CCI) is at -174, a deeply oversold reading, often preceding a bullish bounce.
Stochastic %K is at 16.1, and RSI at 36.1 — both nearing or in oversold territory.
Price is sitting on S1 Pivot (0.81611) and close to the range floor, where previous rebounds occurred.
Heatmap Fundamentals show NZD strengthening while CAD remains relatively weak, supporting bullish outlook.
⚠️ Bearish Pressure Risks
All major moving averages (from EMA10 to SMA200) are above price and aligned in a bearish stack.
Break and close below 0.81600 would invalidate the range and expose the next targets near 0.81000 and 0.80000.
Momentum is still weak, so confirmation of a bounce is essential before entering a long.
📌 Strategic Conclusion
If the 0.81800 support holds with bullish price action confirmation, this presents a high-reward long opportunity, aiming for a breakout above 0.83000 and extension toward 0.84000 or higher.
If 0.81600 fails decisively, traders should shift to a bearish outlook, targeting the 0.81000 and 0.80000 zones.
Disclaimer
The information and publications are not meant to be, and do not constitute, financial, investment, trading, or other types of advice or recommendations supplied or endorsed by TradingView. Read more in the Terms of Use.
Disclaimer
The information and publications are not meant to be, and do not constitute, financial, investment, trading, or other types of advice or recommendations supplied or endorsed by TradingView. Read more in the Terms of Use.