Price was consolidating in the last 2 months, now it finally broke the level and got the retest waiting for a beutiful Bearsih Engulfing 30M,1H,2H to enter this trade.
very clear trade for me this week, it has to start now the downtrend.
---
### 🔎 **Multi‑timeframe Bias**
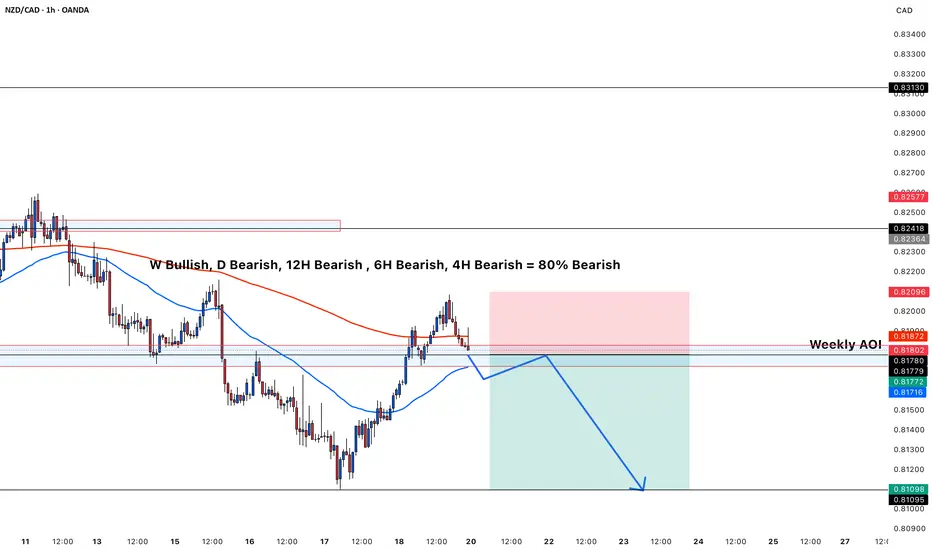
* **Weekly:** Bullish (but higher‑timeframe bullishness often takes longer to play out; intraday moves can still be bearish).
* **Daily:** Bearish
* **12H:** Bearish
* **6H:** Bearish
* **4H:** Bearish
✅ **Result:** 80% of your major timeframes are **aligned bearish**, giving you strong confluence to look for sells rather than buys.
---
### 📉 **Structure and Price Action**
* **Market Structure:**
Price is making **lower highs and lower lows** on the 4H and 1H timeframes, which confirms a **downtrend** in the short/medium term.
* **Current Zone:**
Price is currently reacting from a **Weekly Area of Interest (AOI)**, a previous support now acting as resistance.
* **Bearish Rejection:**
The recent move up into the AOI has been rejected, shown by the price failing to break above the resistance zone and starting to turn down.
---
### 📊 **Moving Averages**
* **50 EMA (blue) is below the 200 EMA (red):** classic bearish alignment.
* Price is currently **under the 200 EMA** and testing the 50 EMA from above — if it breaks back below, this often signals momentum returning to the downside.
---
### 📐 **Risk‑Reward and Setup**
* You’ve marked a **short entry** from the AOI, with:
* **Stop Loss** above the resistance zone (red area)
* **Take Profit** targeting lower liquidity levels (green area near 0.8110)
* The projected move matches the dominant trend direction, increasing probability.
very clear trade for me this week, it has to start now the downtrend.
---
### 🔎 **Multi‑timeframe Bias**
* **Weekly:** Bullish (but higher‑timeframe bullishness often takes longer to play out; intraday moves can still be bearish).
* **Daily:** Bearish
* **12H:** Bearish
* **6H:** Bearish
* **4H:** Bearish
✅ **Result:** 80% of your major timeframes are **aligned bearish**, giving you strong confluence to look for sells rather than buys.
---
### 📉 **Structure and Price Action**
* **Market Structure:**
Price is making **lower highs and lower lows** on the 4H and 1H timeframes, which confirms a **downtrend** in the short/medium term.
* **Current Zone:**
Price is currently reacting from a **Weekly Area of Interest (AOI)**, a previous support now acting as resistance.
* **Bearish Rejection:**
The recent move up into the AOI has been rejected, shown by the price failing to break above the resistance zone and starting to turn down.
---
### 📊 **Moving Averages**
* **50 EMA (blue) is below the 200 EMA (red):** classic bearish alignment.
* Price is currently **under the 200 EMA** and testing the 50 EMA from above — if it breaks back below, this often signals momentum returning to the downside.
---
### 📐 **Risk‑Reward and Setup**
* You’ve marked a **short entry** from the AOI, with:
* **Stop Loss** above the resistance zone (red area)
* **Take Profit** targeting lower liquidity levels (green area near 0.8110)
* The projected move matches the dominant trend direction, increasing probability.
Disclaimer
The information and publications are not meant to be, and do not constitute, financial, investment, trading, or other types of advice or recommendations supplied or endorsed by TradingView. Read more in the Terms of Use.
Disclaimer
The information and publications are not meant to be, and do not constitute, financial, investment, trading, or other types of advice or recommendations supplied or endorsed by TradingView. Read more in the Terms of Use.