🧠 Timeframe Sentiment Overview
Weekly (W): Bullish
Daily (D): Bullish
12H, 6H, 4H: Bearish
Bias: Weak bearish retracement inside HTF bullish trend. Caution advised—likely a counter-trend play or short-term pullback trade.
📉 Market Structure Analysis
Bearish BOS recently occurred on 4H with a sharp drop.
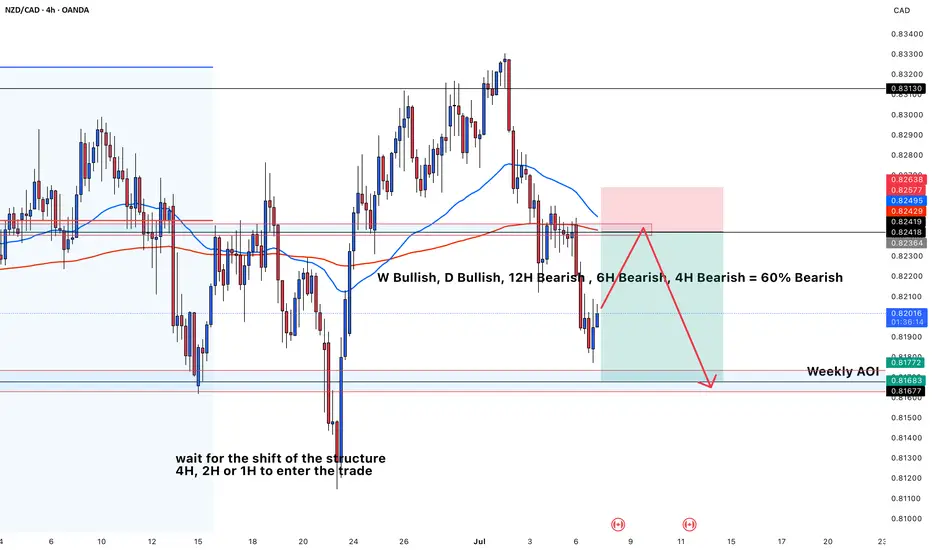
Price is now forming a potential lower high at previous support flipped resistance (around 0.82400–0.82550), shown in the red box.
Red arrow forecasts a continuation lower if price respects the short-term supply zone.
📊 EMA Confluence
Price is currently below both the 50 EMA (blue) and 200 EMA (red) → indicates a bearish short-term trend.
EMAs act as dynamic resistance in the supply zone.
🟥 Short Trade Setup
Entry Zone: Pullback into 0.82400–0.82577 (marked supply zone).
Stop Loss: Just above the red zone at ~0.82638.
Take Profit (TP): Weekly AOI at ~0.81680–0.81770, previous demand + liquidity zone.
Risk-Reward Ratio: Approximately 2:1 or better.
🔁 Strategy Notes
Since HTF is bullish (W + D), this is a counter-trend move, so confirmation (e.g. on 1H or 15m) is important.
Text on chart suggests waiting for 1H structure shift before executing the trade for better timing and lower risk.
✅ Confluences Supporting the Short
Clear 4H BOS and bearish momentum.
Bearish EMAs alignment (50 < 200).
Price entering previous support turned resistance.
Weekly AOI (target) is a high-probability demand zone.
Bearish momentum from 12H/6H/4H despite higher TF bullishness.
⚠️ Caution
Since W and D are bullish, price could bounce aggressively from the Weekly AOI.
Monitor LTF reaction closely for exit/reversal.
Weekly (W): Bullish
Daily (D): Bullish
12H, 6H, 4H: Bearish
Bias: Weak bearish retracement inside HTF bullish trend. Caution advised—likely a counter-trend play or short-term pullback trade.
📉 Market Structure Analysis
Bearish BOS recently occurred on 4H with a sharp drop.
Price is now forming a potential lower high at previous support flipped resistance (around 0.82400–0.82550), shown in the red box.
Red arrow forecasts a continuation lower if price respects the short-term supply zone.
📊 EMA Confluence
Price is currently below both the 50 EMA (blue) and 200 EMA (red) → indicates a bearish short-term trend.
EMAs act as dynamic resistance in the supply zone.
🟥 Short Trade Setup
Entry Zone: Pullback into 0.82400–0.82577 (marked supply zone).
Stop Loss: Just above the red zone at ~0.82638.
Take Profit (TP): Weekly AOI at ~0.81680–0.81770, previous demand + liquidity zone.
Risk-Reward Ratio: Approximately 2:1 or better.
🔁 Strategy Notes
Since HTF is bullish (W + D), this is a counter-trend move, so confirmation (e.g. on 1H or 15m) is important.
Text on chart suggests waiting for 1H structure shift before executing the trade for better timing and lower risk.
✅ Confluences Supporting the Short
Clear 4H BOS and bearish momentum.
Bearish EMAs alignment (50 < 200).
Price entering previous support turned resistance.
Weekly AOI (target) is a high-probability demand zone.
Bearish momentum from 12H/6H/4H despite higher TF bullishness.
⚠️ Caution
Since W and D are bullish, price could bounce aggressively from the Weekly AOI.
Monitor LTF reaction closely for exit/reversal.
Disclaimer
The information and publications are not meant to be, and do not constitute, financial, investment, trading, or other types of advice or recommendations supplied or endorsed by TradingView. Read more in the Terms of Use.
Disclaimer
The information and publications are not meant to be, and do not constitute, financial, investment, trading, or other types of advice or recommendations supplied or endorsed by TradingView. Read more in the Terms of Use.