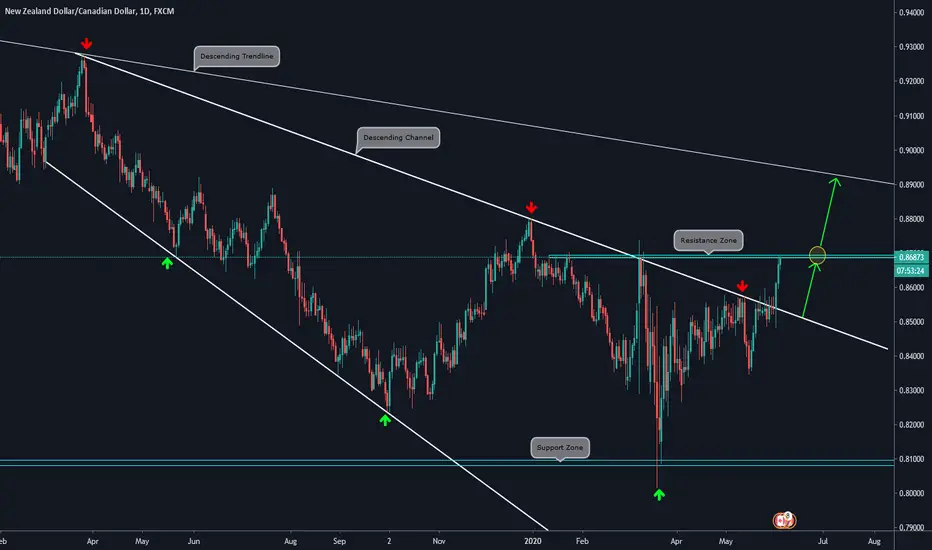
🔸 DAILY CHART EXPLANATION:
.
.
🔸 Price made a strong upside move that broke the Descending Trendline.
.
🔸 At this level it can bounce and make a corrective move towards the 0.85500 Zone.
.
🔸 If the level can not hold the price, then the bullish impulse could continue towards the Weekly Descending Trendline.
.
🔸 Will look for a lower timeframe setup.
🔸4H CHART ANALYSIS:

.
.
🔸 Price made a strong upside move that broke the Descending Trendline.
.
🔸 At this level it can bounce and make a corrective move towards the 0.85500 Zone.
.
🔸 If the level can not hold the price, then the bullish impulse could continue towards the Weekly Descending Trendline.
.
🔸 Will look for a lower timeframe setup.
🔸4H CHART ANALYSIS:
Disclaimer
The information and publications are not meant to be, and do not constitute, financial, investment, trading, or other types of advice or recommendations supplied or endorsed by TradingView. Read more in the Terms of Use.
Disclaimer
The information and publications are not meant to be, and do not constitute, financial, investment, trading, or other types of advice or recommendations supplied or endorsed by TradingView. Read more in the Terms of Use.