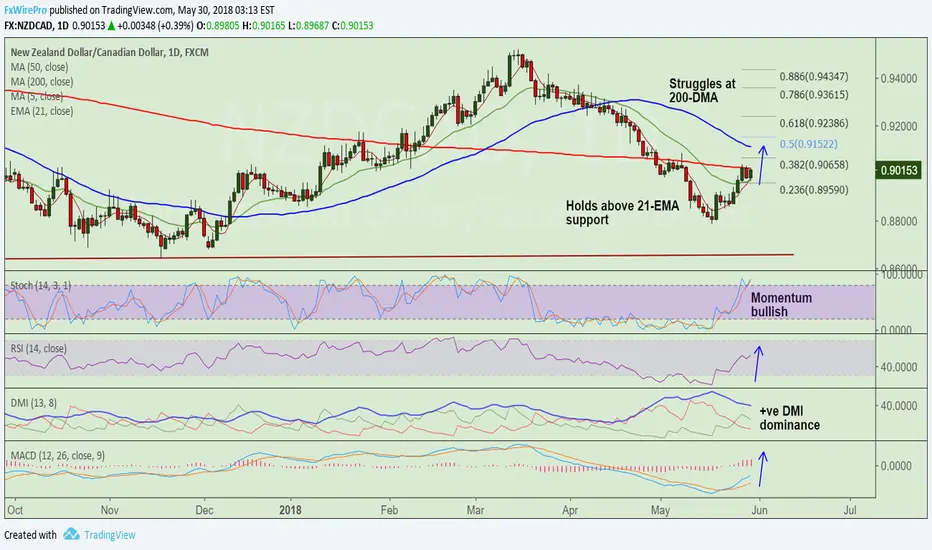
NZD/CAD is extending choppy trade below stiff resistance at 200-DMA at 0.9022.
Technical indicators are biased higher. Momentum studies are bullish. Trend indicators support upside.
Breakout at 200-DMA raises scope for test of 50-DMA at 0.9112 ahead of 61.8% Fib at 0.9238.
On the flipside, the pair is holding above 21-EMA which is strong support at 0.8969. We see weakness only on break below.
Support levels - 0.8981 (5-DMA), 0.8969 (21-EMA), 0.89, 0.8880 (Jan 5 lows)
Resistance levels - 0.9022 (200-DMA), 0.9065 (38.2% Fib), 0.91, 0.9112 (50-DMA
Good to go long on decisive break above 200-DMA, target 0.9065/ 0.91/ 0.9120
Note
Hovers shy of 0.91.200W SMA at 0.91 is strong resistance.
Further upside only on break above.
Disclaimer
The information and publications are not meant to be, and do not constitute, financial, investment, trading, or other types of advice or recommendations supplied or endorsed by TradingView. Read more in the Terms of Use.
Disclaimer
The information and publications are not meant to be, and do not constitute, financial, investment, trading, or other types of advice or recommendations supplied or endorsed by TradingView. Read more in the Terms of Use.