Good day Traders,
Trust you are well.
Below is my analysis of NZDCAD.
Overview:
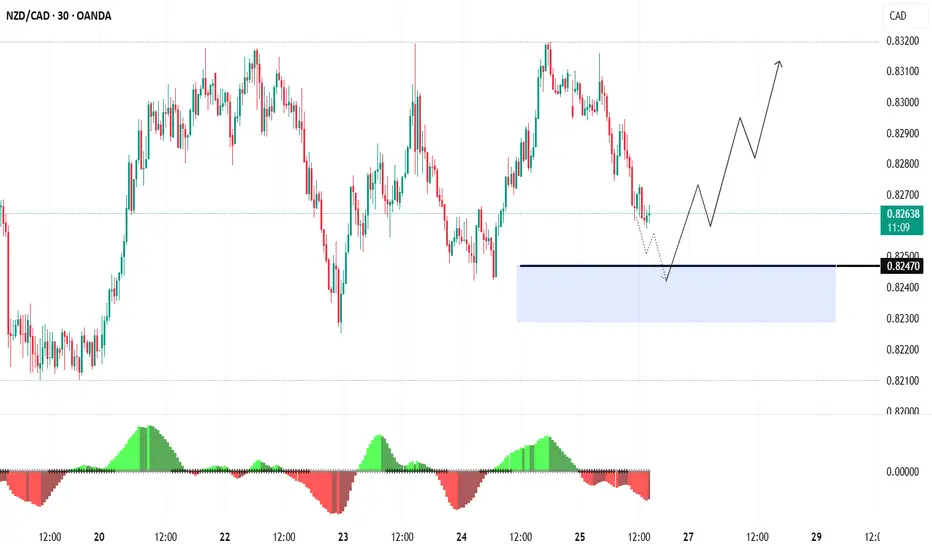
NZDCAD is retracing from the recent high at 0.83050, currently trading around 0.82628. Price action is approaching a key support zone between 0.82470 – 0.82285, an area that previously triggered bullish reactions. Momentum indicators are showing bearish pressure, with red histogram bars visible on the chart.
Idea:
Although bearish momentum is present, the histogram shows a slight decrease in selling pressure, hinting at a potential slowdown in the current downtrend. If the pair holds above the 0.82287 level, it could signal a potential reversal or bounce. This would open room for bullish targets at: 0.82898, 0.83039 and 0.83110.
However, a confirmed break below 0.82287 could expose the next support around 0.82100.
Conclusion:
The pair is at a critical support zone, with decreasing momentum suggesting that sellers may be losing strength. A bounce from current levels could provide a short-term buying opportunity, while a break below 0.82287 would invalidate the bullish outlook.
Cheers and happy trading!
Trust you are well.
Below is my analysis of NZDCAD.
Overview:
NZDCAD is retracing from the recent high at 0.83050, currently trading around 0.82628. Price action is approaching a key support zone between 0.82470 – 0.82285, an area that previously triggered bullish reactions. Momentum indicators are showing bearish pressure, with red histogram bars visible on the chart.
Idea:
Although bearish momentum is present, the histogram shows a slight decrease in selling pressure, hinting at a potential slowdown in the current downtrend. If the pair holds above the 0.82287 level, it could signal a potential reversal or bounce. This would open room for bullish targets at: 0.82898, 0.83039 and 0.83110.
However, a confirmed break below 0.82287 could expose the next support around 0.82100.
Conclusion:
The pair is at a critical support zone, with decreasing momentum suggesting that sellers may be losing strength. A bounce from current levels could provide a short-term buying opportunity, while a break below 0.82287 would invalidate the bullish outlook.
Cheers and happy trading!
Trade active
The pair did +30pips and reversed.Related publications
Disclaimer
The information and publications are not meant to be, and do not constitute, financial, investment, trading, or other types of advice or recommendations supplied or endorsed by TradingView. Read more in the Terms of Use.
Related publications
Disclaimer
The information and publications are not meant to be, and do not constitute, financial, investment, trading, or other types of advice or recommendations supplied or endorsed by TradingView. Read more in the Terms of Use.