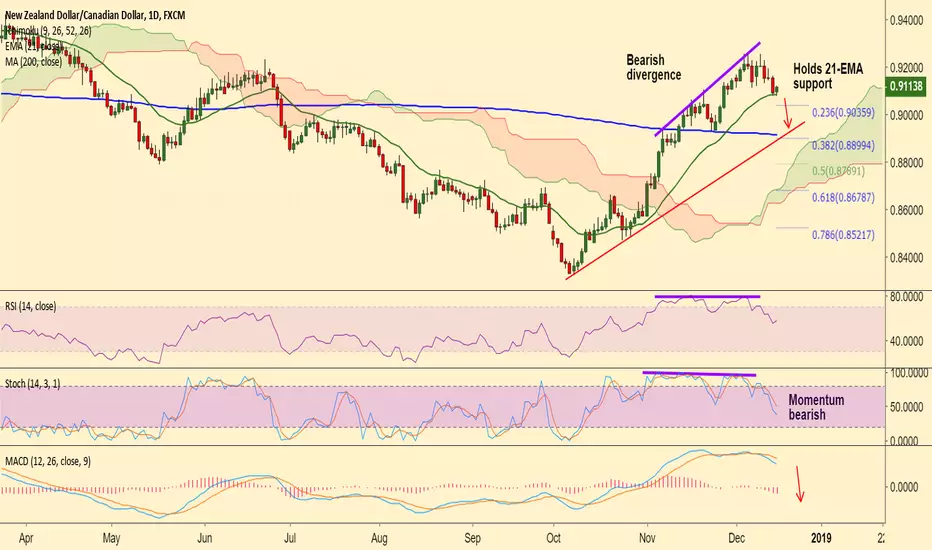
NZD/CAD finds strong support at 21-EMA, break below to see weakness.
Bearish divergence on RSI and Stochs which adds to the bearish bias.
Support levels - 0.9084 (21-EMA), 0.9035 (23.6% Fib), 0.90, 0.8914 (200-DMA)
Resistance levels - 0.9143 (5-DMA), 0.92, 0.9251 (Dec 11 high)
Watch out for break below 21-EMA to go short, target 0.8950/ 0.8915.
Bearish divergence on RSI and Stochs which adds to the bearish bias.
Support levels - 0.9084 (21-EMA), 0.9035 (23.6% Fib), 0.90, 0.8914 (200-DMA)
Resistance levels - 0.9143 (5-DMA), 0.92, 0.9251 (Dec 11 high)
Watch out for break below 21-EMA to go short, target 0.8950/ 0.8915.
Note
Breaks below 21-EMA. Eyes 200-DMA at 0.89.Note
Breaks below 55-EMA. TP1 hit.
Disclaimer
The information and publications are not meant to be, and do not constitute, financial, investment, trading, or other types of advice or recommendations supplied or endorsed by TradingView. Read more in the Terms of Use.
Disclaimer
The information and publications are not meant to be, and do not constitute, financial, investment, trading, or other types of advice or recommendations supplied or endorsed by TradingView. Read more in the Terms of Use.