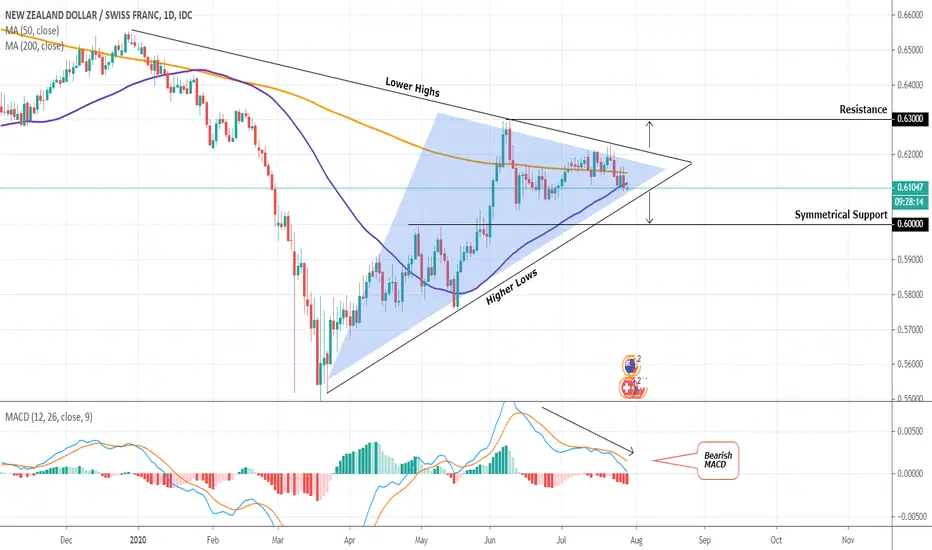
Pattern: Triangle on 1D.
Signal: (A) Bullish if the Lower Highs trend-line breaks, (B) Bearish if the Higher Lows trend-line breaks.
Target: (A) 0.6300 (the Resistance), (B) 0.6000 (the Symmetrical Support).
** Please support this idea with your likes and comments, it is the best way to keep it relevant and support me. **
Most recent NZDCHF signal:
👑Best Signals (Forex/Crypto+70% accuracy) & Account Management (+20% profit/month on 10k accounts)
💰Free Channel t.me/tradingshotglobal
🤵Contact info@tradingshot.com t.me/tradingshot
🔥New service: next X100 crypto GEMS!
💰Free Channel t.me/tradingshotglobal
🤵Contact info@tradingshot.com t.me/tradingshot
🔥New service: next X100 crypto GEMS!
Disclaimer
The information and publications are not meant to be, and do not constitute, financial, investment, trading, or other types of advice or recommendations supplied or endorsed by TradingView. Read more in the Terms of Use.