NZD/CHF Potential Bullish Reversal Setup 🔄📈
📊 Chart Analysis:
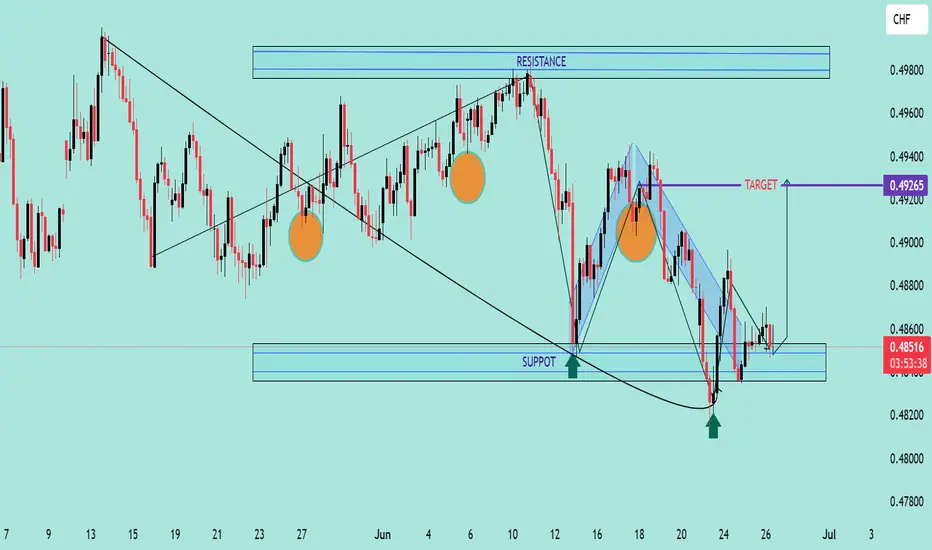
The chart shows a potential bullish reversal for NZD/CHF, supported by technical patterns and key levels:
🧠 Key Technical Highlights:
🔹 Double Bottom Formation (🟠 Circles)
A clear double bottom pattern can be seen around the 0.48300 support zone, signaling potential reversal from the downtrend.
🔹 Strong Support Zone 📉
Price bounced from a historically respected support zone (~0.48200–0.48400), which held several times in the past (marked with green arrows).
🔹 Downtrend Breakout 🔺
A short-term bearish channel has been broken to the upside, indicating potential bullish pressure.
🔹 Target Zone 🎯
Immediate bullish target is around 0.49265, aligning with previous resistance.
🔹 Resistance Area (🔵 Boxes)
Next significant resistance lies at 0.49400–0.49800, which may act as the next hurdle if price breaks the 0.49265 level.
✅ Conclusion:
As long as price holds above 0.48400, bulls may aim for the 0.49265 🎯 target. A breakout above that level can open the path to higher resistances.
📌 Bullish Bias maintained above support zone — monitor for volume confirmation and retest strength.
📊 Chart Analysis:
The chart shows a potential bullish reversal for NZD/CHF, supported by technical patterns and key levels:
🧠 Key Technical Highlights:
🔹 Double Bottom Formation (🟠 Circles)
A clear double bottom pattern can be seen around the 0.48300 support zone, signaling potential reversal from the downtrend.
🔹 Strong Support Zone 📉
Price bounced from a historically respected support zone (~0.48200–0.48400), which held several times in the past (marked with green arrows).
🔹 Downtrend Breakout 🔺
A short-term bearish channel has been broken to the upside, indicating potential bullish pressure.
🔹 Target Zone 🎯
Immediate bullish target is around 0.49265, aligning with previous resistance.
🔹 Resistance Area (🔵 Boxes)
Next significant resistance lies at 0.49400–0.49800, which may act as the next hurdle if price breaks the 0.49265 level.
✅ Conclusion:
As long as price holds above 0.48400, bulls may aim for the 0.49265 🎯 target. A breakout above that level can open the path to higher resistances.
📌 Bullish Bias maintained above support zone — monitor for volume confirmation and retest strength.
JOIN MY TELEGRAM CHANNEL
t.me/StellarMarketAnalysis
JOIN MY RECOMMENTED BROKER REFFREL LINK
⤵️one.exnesstrack.net/a/uvd1etcgg1
PARTNER CODE⤵️
uvd1etcgg1
t.me/StellarMarketAnalysis
JOIN MY RECOMMENTED BROKER REFFREL LINK
⤵️one.exnesstrack.net/a/uvd1etcgg1
PARTNER CODE⤵️
uvd1etcgg1
Disclaimer
The information and publications are not meant to be, and do not constitute, financial, investment, trading, or other types of advice or recommendations supplied or endorsed by TradingView. Read more in the Terms of Use.