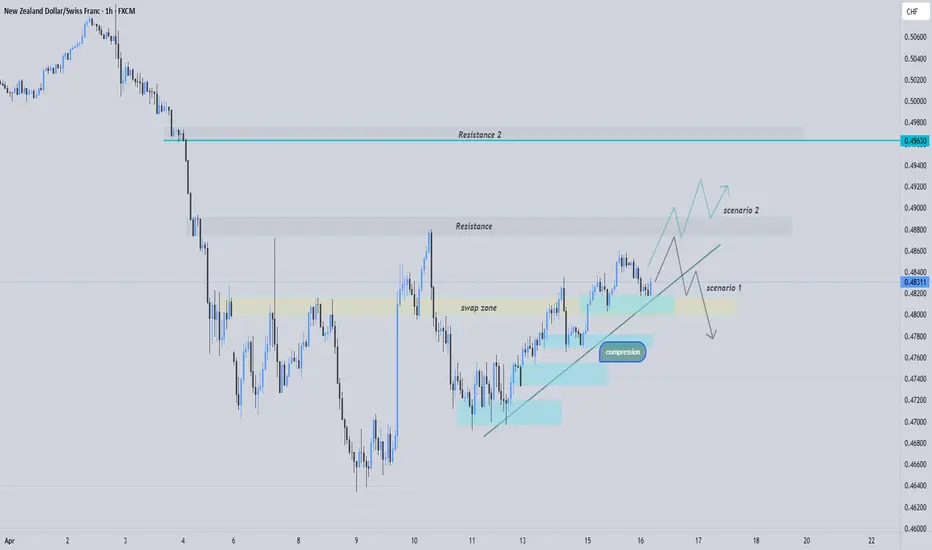
NZDCHF has came back and reached above its neck level of the QM pattern the second time, also having several demand zones reached and respected, pushing price upwards and forming a compression. We can keep an eye out on this pair and make decisions when it reaches the resistance zone once again. There are two possible scenarios that could happen, if it’s able to break above the resistance zone and close bullish candles, we can look for long opportunities and buy it to resistance 2 which is at 0.49630. If there is a strong rejection from resistance, we can then look for pullback and enter on shorts.
However, due to the fact that NZDCHF is still very bearish on the H4 and Daily timeframes, our bias should be bearish and prioritize selling opportunities. On sell trades, we may be able to hold the position longer and target different take profit levels.
Disclaimer
The information and publications are not meant to be, and do not constitute, financial, investment, trading, or other types of advice or recommendations supplied or endorsed by TradingView. Read more in the Terms of Use.
Disclaimer
The information and publications are not meant to be, and do not constitute, financial, investment, trading, or other types of advice or recommendations supplied or endorsed by TradingView. Read more in the Terms of Use.