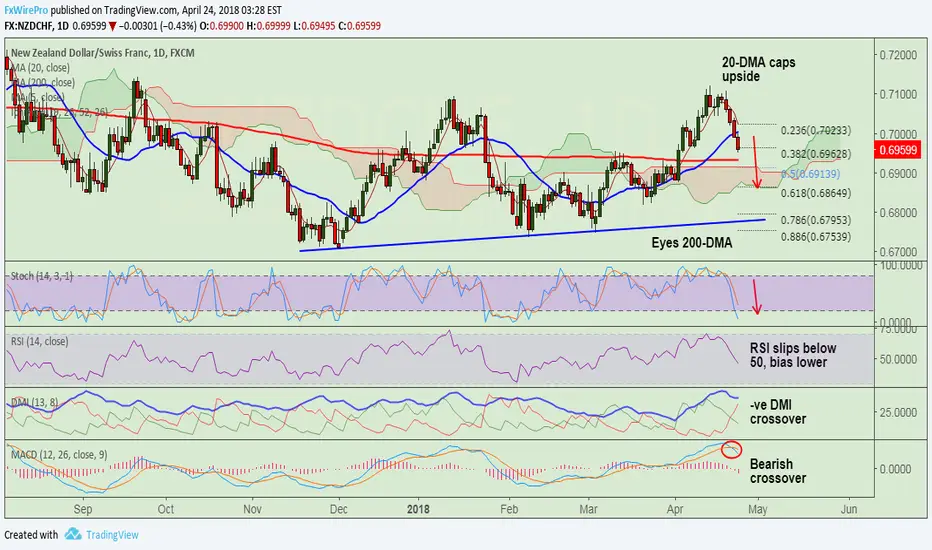
Technical Analysis: Bias Bearish
- RSI and Stochs are biased lower, RSI below 50
- MACD shows bearish crossover on signal line
- -ve DMI crossover on +ve DMI
- Upside capped at 20-DMA (0.70)
Support levels - 0.6933 (200-DMA), 0.6916 (cloud top), 0.6865 (61.8% Fib)
Resistance levels - 0.7003 (20-DMA), 0.7025 (5-DMA), 0.7066 (Jan 23 high)
Good to go short on rallies around 0.6970/80, SL: 0.7010, TP: 0.6935/ 0.69/ 0.6865.
Note
TP1 hit. Hovers around 200-DMA. Break below will see further weakness.
Disclaimer
The information and publications are not meant to be, and do not constitute, financial, investment, trading, or other types of advice or recommendations supplied or endorsed by TradingView. Read more in the Terms of Use.
Disclaimer
The information and publications are not meant to be, and do not constitute, financial, investment, trading, or other types of advice or recommendations supplied or endorsed by TradingView. Read more in the Terms of Use.