Why am I looking to trade NZDCHF LONG?
Reason:
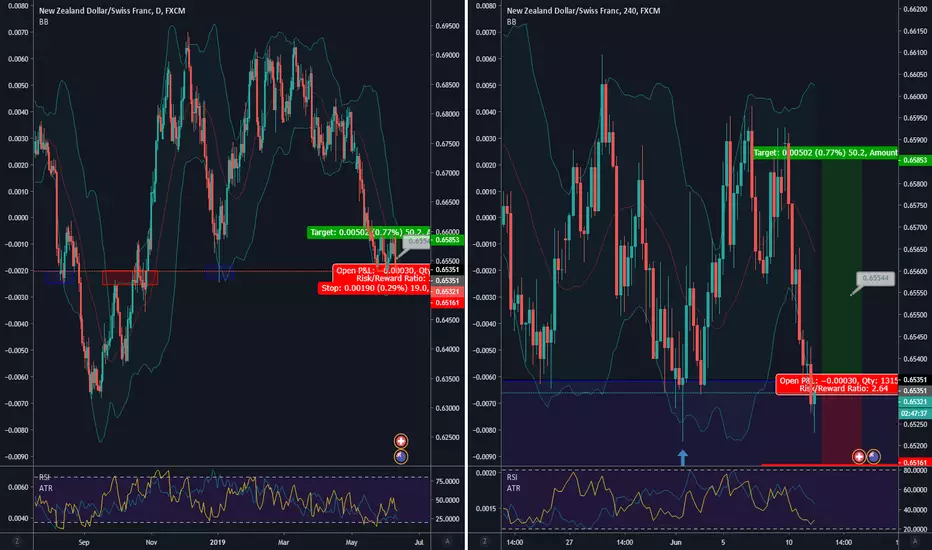
We have an extreme peirce candle outside of the Bollinger band.
Looking left on the daily chart we are in a solid area of support and resistance (blue and red boxes) price has respected these areas before.
Some traders may consider the Bollinger break candle on the 60 min chart as a valid double bottom reversal
Entry:
5 pips buy stop above the current pin bar
Stops:
5 pips below the previous extreme candle
Targets:
Target 1:
1:1 – 0.6544
Target 2:
4 pips below daily high
As always good luck in the markets,
TradeEasy.
Reason:
We have an extreme peirce candle outside of the Bollinger band.
Looking left on the daily chart we are in a solid area of support and resistance (blue and red boxes) price has respected these areas before.
Some traders may consider the Bollinger break candle on the 60 min chart as a valid double bottom reversal
Entry:
5 pips buy stop above the current pin bar
Stops:
5 pips below the previous extreme candle
Targets:
Target 1:
1:1 – 0.6544
Target 2:
4 pips below daily high
As always good luck in the markets,
TradeEasy.
Trade closed: stop reached
Disclaimer
The information and publications are not meant to be, and do not constitute, financial, investment, trading, or other types of advice or recommendations supplied or endorsed by TradingView. Read more in the Terms of Use.
Disclaimer
The information and publications are not meant to be, and do not constitute, financial, investment, trading, or other types of advice or recommendations supplied or endorsed by TradingView. Read more in the Terms of Use.