CORE Analysis Method: Smart Money Concepts
😇 7 Dimension Analysis
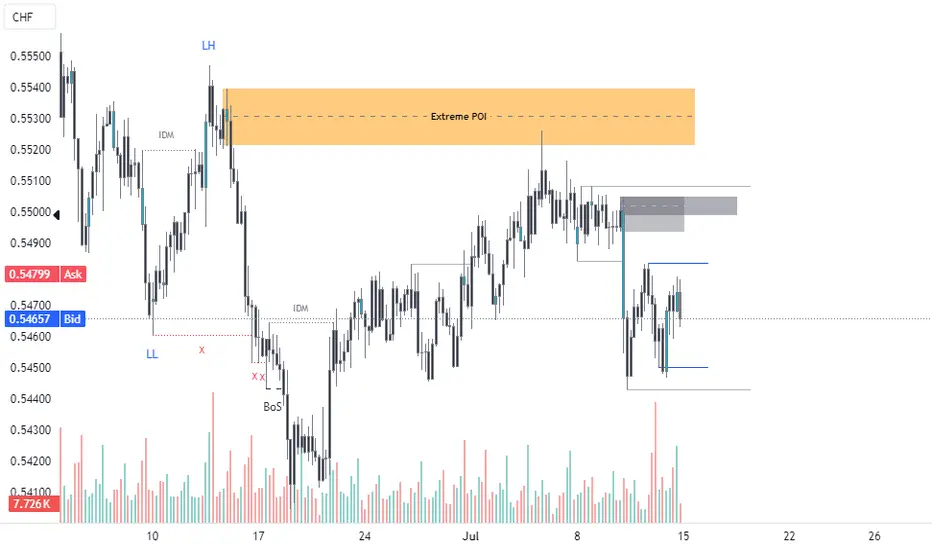
Time Frame: H4
1️⃣ Swing Structure: Bearish with BOS
🟢 Impulsive Move: Started after the extreme POI mitigation.
🟢 Pullback: Inside the impulsive move, this is the first pullback, which might come back to take liquidity.
🟢 Internal Structure: 15 min is also bearish.
🟢 EXT OB: Used as POI in the Premier zone of the internal structure.
2️⃣ Pattern
🟢 CHART PATTERNS:
No specific chart patterns identified for this setup.
🟢 CANDLE PATTERNS:
Will be monitored once the price reaches the execution level.
3️⃣ Volume
🟢 Volume during correction: Needs monitoring, but generally, volume tends to dry up during corrections before increasing at points of interest.
4️⃣ Momentum RSI
🟢 Zone: In a bearish zone, confirming the bearish sentiment of the market.
5️⃣ Volatility Bollinger Bands
🟢 Current Phase: Monitoring needed for contraction or expansion phases. Band behavior indicates a possible breakout or continuation of the trend.
6️⃣ Strength: The market shows bearish strength without significant bullish interference.
7️⃣ Sentiment: Bearish.
✔️ Entry Time Frame: 15 min
✅ Entry TF Structure: Bearish
✔ Entry Time EXT OB: Is POI
💡 Decision: SELL
🚀 Entry: 0.5498
✋ Stop loss: 0.5505
🎯 Take profit: 0.5402
😊 Risk to reward Ratio: 13 RR
🕛 Expected Duration: 5 days
SUMMARY
The analysis identifies a bearish swing structure on the H4 time frame, marked by a Break of Structure (BOS) and an impulsive move starting after the extreme Point of Interest (POI) mitigation. Inside this impulsive move, the first pullback might come back to take liquidity. The internal structure on the 15-minute time frame is also bearish, using the extreme Order Block (OB) as the POI in the Premier zone of the internal structure.
There are no specific chart patterns identified for this setup. Candle patterns will be monitored once the price reaches the execution level. Volume analysis indicates that volume typically dries up during corrections before increasing at points of interest, which needs monitoring.
Momentum RSI is in a bearish zone, confirming the bearish sentiment of the market. Bollinger Bands indicate the need for monitoring contraction or expansion phases, suggesting a possible breakout or continuation of the trend.
The market shows bearish strength without significant bullish interference, with a general bearish sentiment. The entry time frame is 15 minutes, with the entry structure indicating bearishness and the POI filled with the EXT OB.
The decision is to sell at 0.5498, with a stop loss at 0.5505 and a take profit at 0.5402, providing a 13:1 risk to reward ratio. The expected duration for this trade setup is 5 days, based on market conditions and price behavior as outlined.
😇 7 Dimension Analysis
Time Frame: H4
1️⃣ Swing Structure: Bearish with BOS
🟢 Impulsive Move: Started after the extreme POI mitigation.
🟢 Pullback: Inside the impulsive move, this is the first pullback, which might come back to take liquidity.
🟢 Internal Structure: 15 min is also bearish.
🟢 EXT OB: Used as POI in the Premier zone of the internal structure.
2️⃣ Pattern
🟢 CHART PATTERNS:
No specific chart patterns identified for this setup.
🟢 CANDLE PATTERNS:
Will be monitored once the price reaches the execution level.
3️⃣ Volume
🟢 Volume during correction: Needs monitoring, but generally, volume tends to dry up during corrections before increasing at points of interest.
4️⃣ Momentum RSI
🟢 Zone: In a bearish zone, confirming the bearish sentiment of the market.
5️⃣ Volatility Bollinger Bands
🟢 Current Phase: Monitoring needed for contraction or expansion phases. Band behavior indicates a possible breakout or continuation of the trend.
6️⃣ Strength: The market shows bearish strength without significant bullish interference.
7️⃣ Sentiment: Bearish.
✔️ Entry Time Frame: 15 min
✅ Entry TF Structure: Bearish
✔ Entry Time EXT OB: Is POI
💡 Decision: SELL
🚀 Entry: 0.5498
✋ Stop loss: 0.5505
🎯 Take profit: 0.5402
😊 Risk to reward Ratio: 13 RR
🕛 Expected Duration: 5 days
SUMMARY
The analysis identifies a bearish swing structure on the H4 time frame, marked by a Break of Structure (BOS) and an impulsive move starting after the extreme Point of Interest (POI) mitigation. Inside this impulsive move, the first pullback might come back to take liquidity. The internal structure on the 15-minute time frame is also bearish, using the extreme Order Block (OB) as the POI in the Premier zone of the internal structure.
There are no specific chart patterns identified for this setup. Candle patterns will be monitored once the price reaches the execution level. Volume analysis indicates that volume typically dries up during corrections before increasing at points of interest, which needs monitoring.
Momentum RSI is in a bearish zone, confirming the bearish sentiment of the market. Bollinger Bands indicate the need for monitoring contraction or expansion phases, suggesting a possible breakout or continuation of the trend.
The market shows bearish strength without significant bullish interference, with a general bearish sentiment. The entry time frame is 15 minutes, with the entry structure indicating bearishness and the POI filled with the EXT OB.
The decision is to sell at 0.5498, with a stop loss at 0.5505 and a take profit at 0.5402, providing a 13:1 risk to reward ratio. The expected duration for this trade setup is 5 days, based on market conditions and price behavior as outlined.
Trade closed: target reached
Disclaimer
The information and publications are not meant to be, and do not constitute, financial, investment, trading, or other types of advice or recommendations supplied or endorsed by TradingView. Read more in the Terms of Use.
Disclaimer
The information and publications are not meant to be, and do not constitute, financial, investment, trading, or other types of advice or recommendations supplied or endorsed by TradingView. Read more in the Terms of Use.