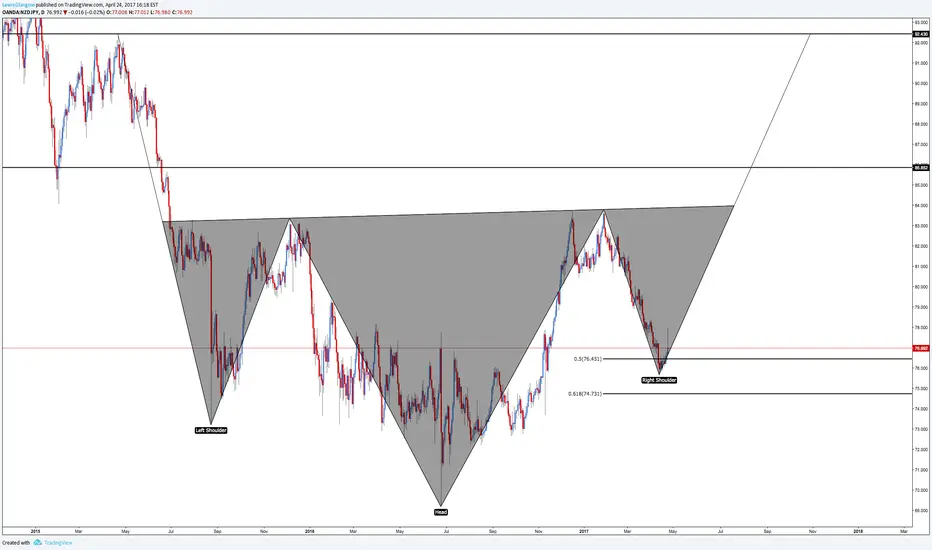
There are some amazing setups forming on the charts, here we have NZD/JPY on the daily chart with an inverted head and shoulders pattern.
The same pattern can be found on CAD/JPY (chart is shown below).
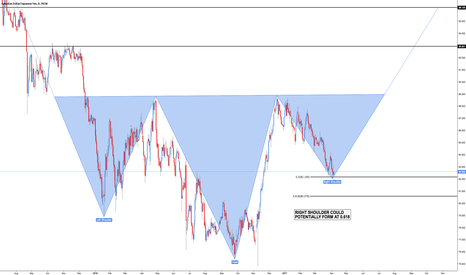
The right shoulder is currently sitting below the 0.50 retracement level but it may complete at 0.618, which is an ideal level as pattern as a whole generally holds a better structure in this situation.
The neckline is bang on a key resistance level, closing above this would provide additional confirmation to go long.
Use this analysis to back up your own ideas! Don't forget to add me on social media :)
The same pattern can be found on CAD/JPY (chart is shown below).
The right shoulder is currently sitting below the 0.50 retracement level but it may complete at 0.618, which is an ideal level as pattern as a whole generally holds a better structure in this situation.
The neckline is bang on a key resistance level, closing above this would provide additional confirmation to go long.
Use this analysis to back up your own ideas! Don't forget to add me on social media :)
📈 Master the Art and Science of Trading: sixfigurecapital.com
Related publications
Disclaimer
The information and publications are not meant to be, and do not constitute, financial, investment, trading, or other types of advice or recommendations supplied or endorsed by TradingView. Read more in the Terms of Use.