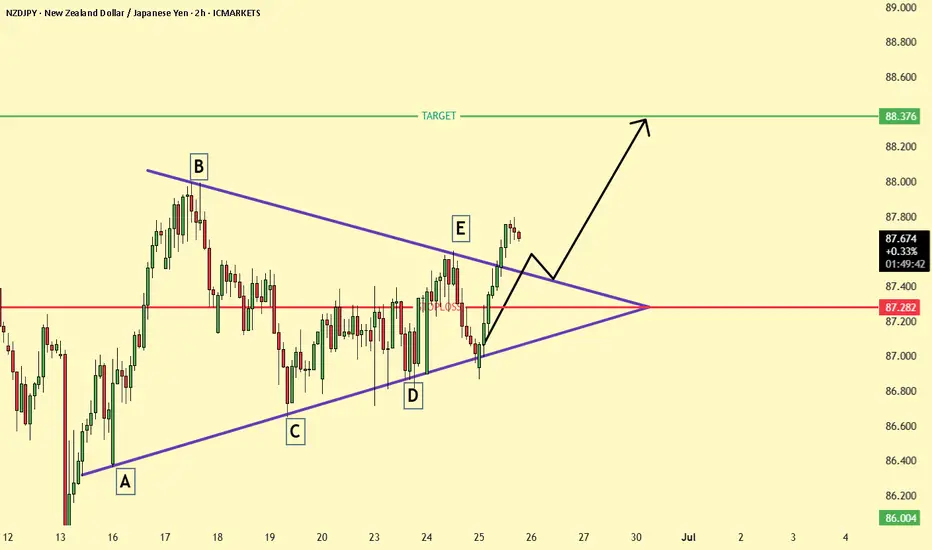
NZD/JPY has broken out of a symmetrical triangle pattern formed by points A to E, signaling a potential bullish continuation. The breakout above the triangle resistance occurred near the 87.3 zone, with price currently pulling back slightly for a possible retest. If the retest holds, the pair is likely to move toward the next resistance target at 88.376. The structure suggests strong momentum favoring buyers in the short term.
Disclaimer
The information and publications are not meant to be, and do not constitute, financial, investment, trading, or other types of advice or recommendations supplied or endorsed by TradingView. Read more in the Terms of Use.
Disclaimer
The information and publications are not meant to be, and do not constitute, financial, investment, trading, or other types of advice or recommendations supplied or endorsed by TradingView. Read more in the Terms of Use.