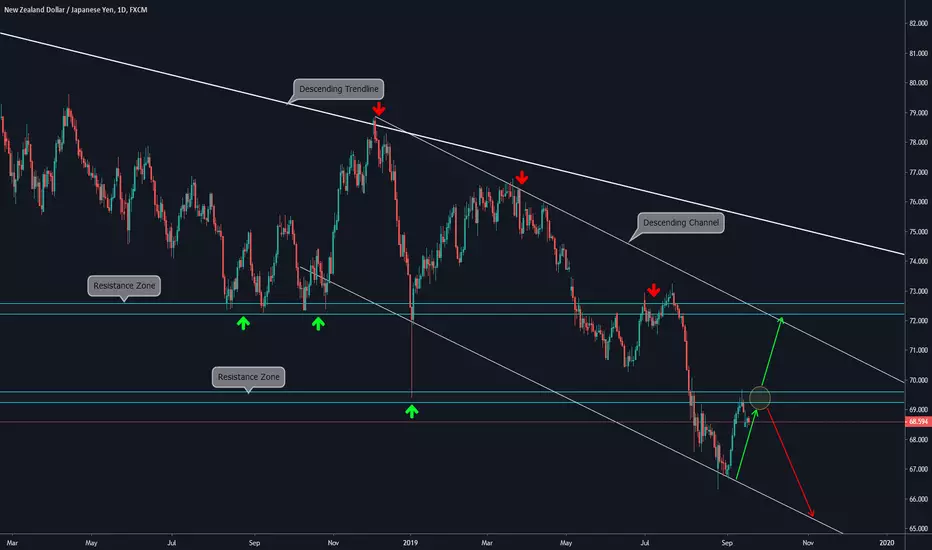
DAILY CHART EXPLANATION:
On daily timeframe, we observe that price broke the Support Zone (now Resistance Zone) but then bounced at the Bottom of the Descending Channel. At this moment it is facing the Resistance Zone, so we have two possible scenarios here.
The first scenario is that price breaks the resistance zone and manages to consolidate above, which enables the possibility of an upward movement towards the Descending Trendline.
The second one, is that the price fails to break the resistance and bounce in the current zone, which would lead to another bearish movement as explained on the Weekly Chart.
WEEKLY CHART:
Disclaimer
The information and publications are not meant to be, and do not constitute, financial, investment, trading, or other types of advice or recommendations supplied or endorsed by TradingView. Read more in the Terms of Use.
Disclaimer
The information and publications are not meant to be, and do not constitute, financial, investment, trading, or other types of advice or recommendations supplied or endorsed by TradingView. Read more in the Terms of Use.