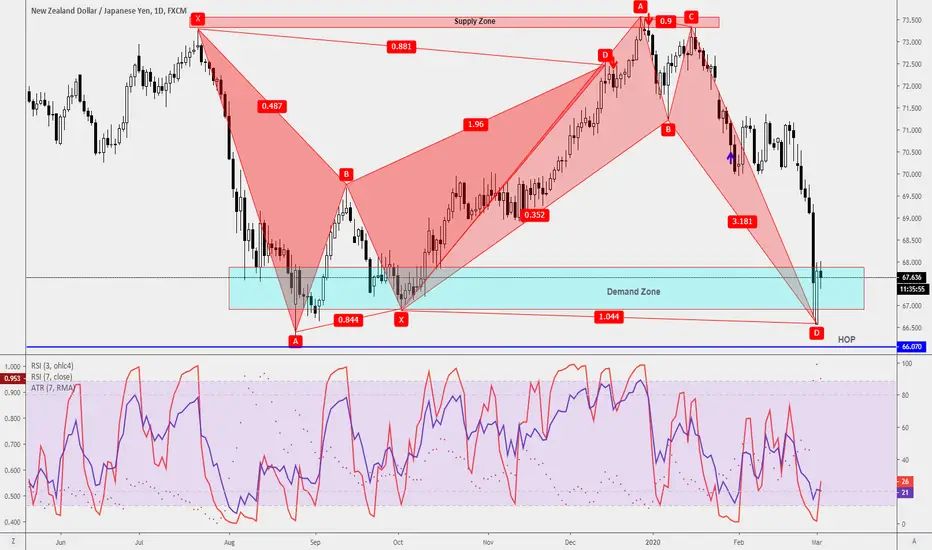
After a massive drop of NZDJPY, a bullish bat pattern is a form as a counter-trend trade. On the little blue box is the area that I see as a demand zone. I'm waiting for the retest of the low before considering engaging the trade. A trade from the daily chart may take up to 2weeks to hit the final target profit area.
If the market travel to the HOP(Harmonic Optimal Price) level, the setup will still be valid.
If the market travel to the HOP(Harmonic Optimal Price) level, the setup will still be valid.
🕒 15mins workday for Young Parents
🏦 Qualify Junior Analyst within 90days
🎤 Keynote Speaker
Get into our 15mins workday community
discord.gg/AKDr9vPqH7
Live session & Trading Tips on the GO
instagram.com/raynlim/
🏦 Qualify Junior Analyst within 90days
🎤 Keynote Speaker
Get into our 15mins workday community
discord.gg/AKDr9vPqH7
Live session & Trading Tips on the GO
instagram.com/raynlim/
Disclaimer
The information and publications are not meant to be, and do not constitute, financial, investment, trading, or other types of advice or recommendations supplied or endorsed by TradingView. Read more in the Terms of Use.